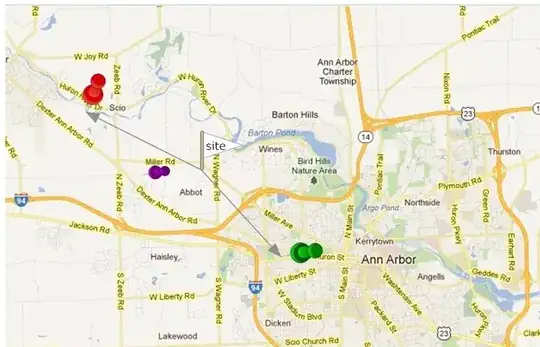
I am estimating sales with data on customer and store locations and attributes using a Huff-style model, where sales decay with drive time and increase with attractiveness of the store.
One hypothetical instance of the problem is illustrated below. The 3 pushpins represent stores and the white flag represents the site where the customers live.** The size of the pins represents the attractiveness of the store (like floor space). The problem I am having is that I would expect red store's sales at the site to be lower than the the green store's even though they are just as far away and have identical attractiveness, because the purple store is somewhat in between the the red store and the site. I would like to translate this intuition into rigorous (but tractable) math so that I add it into my statistical model. I am also having trouble figuring out what this is called in the literature (other than the n-body gravity problem in physics).

** For the daltonic folks, the red store is in the upper left corner. The green store is in the bottom right. Purple store is to the left of the site.