1

Premise: I have read all the stackexchange posts and other material I could find on the subject of outliers, I know Dixon, Grubbs tests, Cook's confidence or DFITS, I know the issues with non-normally distributed data, etc., so in short I kind of know what is the "consensus" on the topic of outliers detection and outliers removal.

I have valid reasons to want to remove the outliers in the specific model/context I am working on. In fact I would say that the model I am working on requires to remove the outliers, to work more safely (including the outliers creates a "too optimistic" prediction of Y based on X).

So, I am not discussing if removing outliers is good or not and I am not asking what are some good methods to detect outliers. I am proposing a specific method that I explain below, to see if it is valid and/or acceptable.

Here is my question: since we know that there are many methods that have been proposed to detect outliers, I am wondering if the follow is acceptable from a scientific point of view.

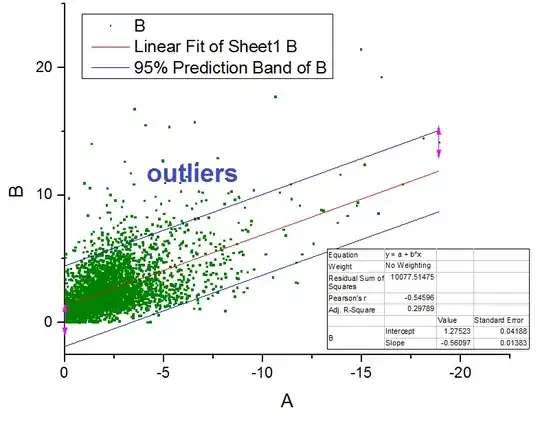
I am working on a Scatterplot like the one below, non-normal data, and assuming my model is well explained by a linear regression, if I plot Prediction Bands (95% confidence level), if I look at the blue Upper Prediction Band, it filters out a part of the data that I would be happy to call outliers and remove it, and then recalculate the linear regression on the data without the outliers.

The procedure it's performed only once to remove the outliers with the Prediction Bands and then the regression is recalculated on the new data, end of procedure.

I would like to know if any of you has ever seen this method used before, and if it is acceptable or valid to detect and remove outliers, starting from the assumption that we want/need to remove the outliers to make the model "safer" in the prediction of Y. scatterplot with Prediction Bands
amoeba
  • 93,463
  • 28
  • 275
  • 317
Statlearner
  • 121
  • 1
  • 6
  • 2
    So there is only a single design variable? I'm surprised you don't seem to mention robust estimation methods. Why bother with removing outliers when you can simply use methods immune to them (the diagnostic output from a robust method would also reveal the outliers reliably)? – user603 Nov 02 '16 at 11:17
  • It looks as if $y$ can not be lower than zero ? –  Nov 02 '16 at 13:01
  • @user603: we have one predictor (X) and one response only (Y). When you say reveal outliers with a diagnostic output from a robust method, do you mean, for example, using the residual plots that are available in various software? I had a look into this, but the problem is this: I get residuals above a certain value (say >6% in the example above) but I would prefer something more X-dependent, in other words I think that the average residual/outliers that come up with diagnostic outputs are too general - maybe I am mistaken, but an Y outlier when X=1 is not the same value as when X=-10 – Statlearner Nov 03 '16 at 09:26
  • @fcop: you are correct, Y cannot be lower than zero. But what I am most worried about is when Y is a big value like 15 or 20, and also, as explained in my previous comment, "outlier Y" may be actually=>5 for X=-2 while it may be =>10 for X=-10, so in conclusion I am trying to figure out a outliers detection method that is sensitive to the X value. Again, I may be all wrong in trying to do this, so feel free to criticize my aim, if so. Thank you all for the help. – Statlearner Nov 03 '16 at 09:29
  • @user603: I did forget to ask: "use methods immune to them" - which ones, for example? Thanks. – Statlearner Nov 03 '16 at 09:31
  • Did you try to take the log of y ? –  Nov 03 '16 at 09:38
  • @Statlearner: there is a large litterature out [there](http://stats.stackexchange.com/a/50780/603). Have a look the MM or Fast-LTS regression. – user603 Nov 03 '16 at 09:46
  • thanks user603, I think you have pointed me in the right direction. Much appreciated. – Statlearner Nov 03 '16 at 14:39
  • does anyone find "R" to be a valid software package for robust regression? I don't see many alternatives apart from SAS/STAT...or Python. – Statlearner Nov 03 '16 at 16:35
  • @Statlearner R is up to the task, [definitly](https://cran.r-project.org/web/views/Robust.html) – user603 Jan 18 '17 at 17:23
  • I agree with @user603. R is the prime vehicle for as many flavours of robust regression as you might want. An excellent reason for this: many originators of new robust methods need to make code available as fast as they devise those methods; they can't wait for or depend on non-freeware implementations. Conversely, there are just as about as many views on how best to do robust regression as there are researchers in the field, so don't expect a consensus on what to do. (As full a disclosure as is needed here: I have no bias against commercial software here and use it most of the time.) – Nick Cox Jan 18 '17 at 17:29
  • 1
    Prediction limits (and bands) for detecting outliers can be fine--*provided they are based on an appropriate model.* The model in this question does a terrible job describing the data (which are censored and heteroscedastic), and for that reason alone it ought not to be used for outlier screening. – whuber Jan 18 '17 at 18:31
  • 1
    How would you defend against a hypothetical criticism that you are biasing your findings by systematically excluding cases that poorly fit your initial model? – rolando2 Jan 18 '17 at 20:12
  • @whuber: are you saying that you would find a quadratic model more appropriate than a linear model, for this data? – Statlearner Jan 22 '17 at 10:23
  • A quadratic model won't cope with either the censoring or the heteroscedasticity. – whuber Jan 22 '17 at 16:47
  • What model you think would fit better? – Statlearner Jan 23 '17 at 10:29

0 Answers0