I made a visualization of Amazon related products. Every link in visualization means two products are often bought together.
Now I'm applying various graph analysis techniques and am fascinated by the results. The biggest problem though is translating scientific terms to human language (please pardon me if it sounds snobberish).
For example, I calculated indegree centrality of nodes, and I called it "What's popular here". After all the most connected node means it's most often bought with all other products in a given graph.
Currently I'm working on betweenness centrality, and it yields quite interesting results, often contradicting degree centrality. But how would you interpret these results? Most important products?
For example, books graph of The art of R programming has the following top 3 nodes:
Indegree Centrality:
- The art of R programming - 18 outgoing edges
- R Cookbook (O'Reilly Cookbooks) - 14 outgoing edges
- Doing Bayesian Data Analysis: A Tutorial with R and BUGS - 10 outgoing edges
Betweenness Centrality:
- The art of R programming - centrality value of 1210
- What is a p-value anyway? - centrality value of 896
- Visualize This - centrality value of 784
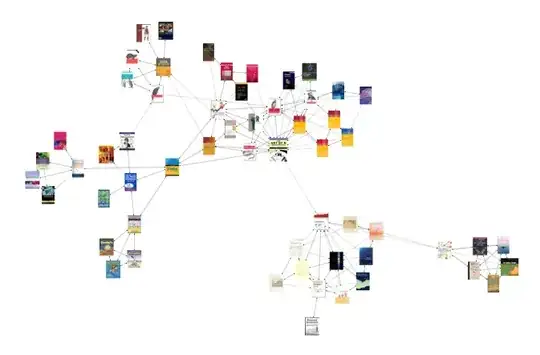
The graph itself looks like this: