4

I investigated dataset using histogram and normaltest. I used scipy.stats.normaltest, got this result:

NormaltestResult(statistic=5.6921385593741958, pvalue=0.058072138171599869)

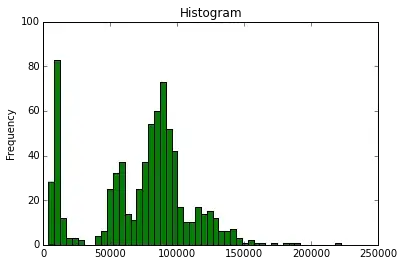
The p-value is slightly larger than 0.05, which means it is normal distribution. But, the histogram seems to be bimodal, so can I conclude that this distribution is not normal distribution regardless of the p-value?

enter image description here

Ferdi
  • 4,882
  • 7
  • 42
  • 62
planaria
  • 43
  • 1
  • 4

3 Answers3

4

This is mostly about understanding how hypothesis testing works. When we test a null hypothesis (here that the data come from a normally distributed population), we can either reject the null hypothesis, or fail to reject the null hypothesis. To understand this more better, it may help to read my answer here: Why do statisticians say a non-significant result means “you can't reject the null” as opposed to accepting the null hypothesis? So your statement that the

p-value is slightly larger than 0.05, which means it is normal distribution

is not correct. It is completely possible that $p > 0.05$ and the data do not come from a normal population.


Setting that aside, we can think about how to address the substantive issue of whether it is reasonable to conclude that a given dataset came from a normally distributed population (or whether the population distribution is close enough for your purposes). The first thing is always to think about what your data are. For example, your data seem to be piled up against 0. Is it possible for these numbers to be negative? If not, they cannot be normal by definition. The next step is to plot your data. Histograms are OK, but qq-plots are generally more recommended (cf., here). Hypothesis tests for distributions are generally not recommended (cf., here).

You can also ask yourself why you want to know if the data are normal; for what purpose is it important that they be? If it is to check off a box so that you can use a particular statistical test, it may not be as important as you think and/or it my be preferable to just use a test that doesn't rely on normality. (For more on that, it may help to read this thread: How to choose between t-test or non-parametric test e.g. Wilcoxon in small samples)
gung - Reinstate Monica
  • 132,789
  • 81
  • 357
  • 650
3

You use the test from D'Agostino and Pearson. This test only tests for the skewness and the kurtosis and not for the whole distribution. Maybe it will help you to read the original papers from D'Agostino and Pearson as well as the python manual. In cases like yours when data is suffering neither from extremely high/low kurtosis nor from left or right skewness the test might give misleading results.

For this reason I usually stick to the far widespread Shapiro Wilk test

Have a look at the following question for a better understanding:

D'Agostino-Pearson vs. Shapiro-Wilk for normality

Ferdi
  • 4,882
  • 7
  • 42
  • 62
  • 1
    I got (0.9391264915466309, 1.0509008736408546e-16) from scipy.stats.shapiro. So, I can conclude that this is not normal and bimodal. – planaria Oct 05 '16 at 13:04
  • If both the the Shapiro-Wilk and the D'Agostino Pearson test reject normality you very probably don't have normality. There are still a couple of other tests like Kolmogorov-Smirnov and Jarque-Bera as well as other methods like graphical methods (e.g. QQPlot), but after seeing the tests and the histogram you can be pretty sure that you can reject normality. – Ferdi Oct 05 '16 at 13:11
0

This data looks clearly bimodal to me. Why is there a clear demarcation for smaller value? Also note that this may change based on the size of the bins in your histogram.

A few other things to consider:

  1. p-values should be used as guides, not Oracles. Use your judgement and, in this case, the histogram of the data to see if it resembles a normal distribution. Are those smaller results outliers? Data errors? Or is your distribution truly bimodal?
  2. Some people will say that you should set your p-value threshold and make a decision about it before running the test. Otherwise you're cherry picking results. If that p-value was 4.95% would you really think the data comes from a Normal? In my opinion, however, you should be looking at a bunch of diagnostics (p-value and histogram among them) and then making a decision.
  3. 5% is not set in stone. People use it for convenience in communicating with others, since everyone is used to 5%. But maybe for you its 1%. Again, use it as a guide.
ilanman
  • 4,503
  • 1
  • 22
  • 46
  • I agree with your comments. At first, I just check the NormaltestResult, but after I drew the histogram, I lean to dataset is bimodal. – planaria Oct 05 '16 at 12:44