1

This is in relation to the already stated question (Trying to setup an experiment - questions about how the data will be analysed), but is more specialised to address the ANCOVA in general.

I have never done ANCOVA tests in SPSS and from what I've seen in tutorials, the moderator variable is commonly AGE, EXPERIENCE etc. So, variables that are not part of the experiment.

My question is, can a moderating variable be something that is manipulated in the experiment? For example, in the question I've already asked I have the diagram complexity which has two factors, "low" and "high" diagram complexity and participants solve questionnaires regarding BOTH complexity levels.

My question is, can "diagram complexity" be a moderating variable? Is it correct to perform ANCOVA when both factors of the moderating variable are applied to each participant?

UPDATE:

The experiment is designed as follows:

  • There are two types of tools (tool1, tool2); there are two types of diagrams (low complexity, high complexity).
  • Participants are categorised into two groups: G1 uses tool1, G2 uses tool2. BOTH GROUPS recieve low AND high complexity diagrams.
  • Participants solve a questionnaire regarding the diagrams; the order in which they receive diagram is randomised (e.g. some participants get high complexity diagrams and then low, others firstly low and then high; regardless, both groups get both diagrams, low and high).

The idea is to investigate if tool1 is significantly better than tool2, so the dependent variable is understandability. Independent variable is tool-type, which is either tool1 or tool2. What is diagram complexity? Another independent variable? In this case I have 4 groups, 2x2 factorial design.
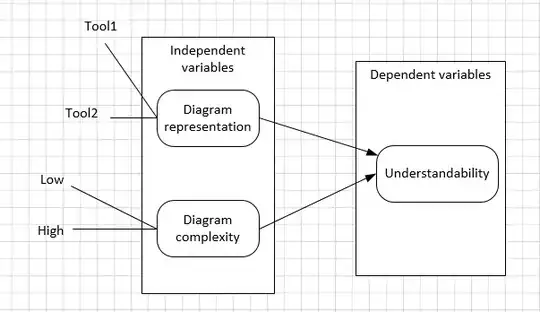
Image below represents the experiment design enter image description here

uglycode
  • 183
  • 2
  • 11
  • ANCOVA is typically used to model continuous covariates in the analysis of a factorial design. If your covariate is discrete (as your question seems to suggest) why not include it as another factor in the ANOVA? – Ian_Fin Sep 26 '16 at 11:02
  • That was my initial idea as well. However, if I include it as another factor, I'd have 2x2 factorial design, meaning that I'd have 4 groups. I actually have just 2 groups: participants that used tool1 and participants that used tool2. Regardless of the tool, both groups solved questions regarding the low and high complexity diagrams. So the idea is that there is a relationship between toolx and understandability of the models, however, diagram complexity influences this relationship. – uglycode Sep 26 '16 at 11:29
  • You'd still have two groups, but you'd have a [within-subjects manipulation](https://en.wikipedia.org/wiki/Repeated_measures_design) as well. A [mixed ANOVA](https://en.wikipedia.org/wiki/Mixed-design_analysis_of_variance) would allow you to analyse this. You'd still be looking for a main effect of tool, there'd just now be a main effect of complexity and an interaction analysed as well. – Ian_Fin Sep 26 '16 at 11:33
  • Thanks for your response, this is starting to make sense to me. I've updated the question where I've described my experiment. If I understand correctly, a mixed ANOVA would address these issues? Then I have a problem defining experimental design; since diagram complexity is not a moderator variable, and it cannot be an independent variable, what should I call it? – uglycode Sep 26 '16 at 11:43
  • Diagram complexity _is_ an independent variable. It's something you manipulate independently of the dependent variable. It's _also_, potentially, a moderator variable, as it may moderate the effect of the tools on understandability. I'm not sure I understand your concern. – Ian_Fin Sep 26 '16 at 12:34
  • I completely agree with you! I've updated my question (again) and added the image of my experimental design. As it is obvious, I've placed both diagram complexity and diagram representation under the independent variables. However, in this case, it's a typical 2x2 factorial design, meaning, it demands for 4 groups (https://web.mst.edu/~psyworld/between_subjects.htm), which I do not have. Therefore, this is not the case in my experiment. Is it possible to visually represent diagram complexity as a "moderator variable", even though it is classified as independent variable? – uglycode Sep 26 '16 at 13:26
  • I think you're misunderstanding what a 2x2 factorial design entails. What you need to have is four groups of observations of your DV, corresponding to each cell of the 2x2 design. When both variables are "manipulated" between-subjects then, yes, you will consequently have four groups of subjects. However, when at least one variable is manipulated within-subjects then you can have less than four groups of subjects but still have four groups of DV observations. In your design you have four groups: tool1-low complexity, tool1-high complexity, tool2-low complexity, and tool2-high complexity – Ian_Fin Sep 26 '16 at 13:32
  • That is absolutely true. I've currently "merged" the results to get 2 groups of data and did t-test kind of experiment. Which is obviously not correct. Now, I understand correctly - I leave the data as is, have 4 groups of data, and analyse it with mixed ANOVA? Is this the correct way to approach my situation? Thank you again for your help, I literally have nowhere else to turn to. – uglycode Sep 26 '16 at 13:34
  • Yeah, as long as you correctly specify which variable is between-subjects and which is within-subjects then the mixed 2x2 ANOVA should give you the information you want about the effect of the tools, while controlling for complexity – Ian_Fin Sep 26 '16 at 13:37
  • Excellent! I don't know if it is possible to mark that visually in the experimental design? Or should I just leave it somewhat like it is now, when I include it in the paper? Dependent variables are of course further defined, I left that out. Additionally, if you care to summarise what you stated here and write an answer, I will accept it. – uglycode Sep 26 '16 at 15:49
  • I'm not sure whether or not to include it in your diagram, but one way of visually representing a moderator is to have the arrow from the variable going to the connection between the other IV and the DV (rather than going to the DV itself). See, for example, [this](http://www.editing-writing.com/wp-content/uploads/moderators-mediators.gif) – Ian_Fin Sep 26 '16 at 16:57
  • Let us [continue this discussion in chat](http://chat.stackexchange.com/rooms/45969/discussion-between-uglycode-and-ian-fin). – uglycode Sep 27 '16 at 13:38
  • Just a quick question: during the analysis I found out that one of the assumptions (normal distribution of the data) is not met. Are there any non-parametric alternatives to mixed ANOVA? I've read about robust mixed ANOVA, but there is no such thing in SPSS. What is the best course of action now? Thank you. – uglycode Sep 27 '16 at 14:00
  • Just to be clear, remember that it's the residuals rather than the observations that have to be normally distributed. That said, no, I don't know of a non-parametric alternative. You may want to ask this as a new question – Ian_Fin Sep 27 '16 at 14:02
  • I think (or rather, I hope) SPSS does this on its own, when testing for normality. I did it based on these instructions: https://statistics.laerd.com/spss-tutorials/testing-for-normality-using-spss-statistics.php there were no special configuration settings or anything like that, I just put the dependent and independent variables in the corresponding boxes and let SPSS do its thing. Is this the correct approach? Does the SPSS test the residuals implicitly? – uglycode Sep 28 '16 at 07:26
  • I suspect that it's checking the observations, rather than the residuals, but I've not used SPSS in a few years so I can't say for sure. – Ian_Fin Sep 28 '16 at 08:13
  • I've extracted residual from the observable and they're still not normally distributed. I will have to find some other way to analyse the data now, I'm kind of out of ideas... – uglycode Sep 28 '16 at 08:31
  • I don't really have an answer but there's two avenues I'd suggest pursuing. If you haven't already, then you may want to consider creating a new question to ask if there's a non-parametric approach to analysing mixed factorial data. The second would be to consider whether treating understandability as a continuous variable, as an ANOVA would, is appropriate. I wouldn't be surprised if it was operationalised in some sort of constrained way (e.g. being bound between 0 and 1, or as points on a Likert scale). If that was the case, you may want to take an alternative approach to analysis – Ian_Fin Sep 28 '16 at 08:40
  • I'm still wasting time on this, nearly going crazy :) What I figured is I don't really need mixed ANOVA, since I don't really care if there are differences between low and high complexity diagrams for one group. I just care about the differences between the groups - the focus is on my tool vs existing tool. I already analysed the data by analysing results for low complexity diagram and high complexity diagram separately. I provide the results based on diagram complexity - so what is the diagram complexity in this case? It's not taken into the consideration when analysing the data... – uglycode Sep 29 '16 at 15:54

2 Answers2

1

ANCOVA is typically used to model continuous covariates in the analysis of a factorial design. Since your covariate is discrete, you could include it as another factor in an ANOVA.

You'd still have two groups, but you'd have a within-subjects manipulation as well. A mixed ANOVA would allow you to analyse this. As long as you correctly specify which variable is between-subjects (the tool a person uses) and which is within-subjects (the diagram complexity) then a mixed 2x2 ANOVA should tell you if there's a main effect of tool on understandability, whilst controlling for complexity.

Ian_Fin
  • 1,129
  • 8
  • 18
0

In this case, the variable, diagram complexity seems to be a discrete variable. So a mixed ANOVA would be appropriate. In ANCOVA, the covariate should be a continuous variable. Alternatively, if you measure the complexity level of the diagrams on an interval scale and do not dichotomise them, you can use it as a covariate and conduct ANCOVA.