6

In order to understand ANOVA and regression better, I read this: http://www.theanalysisfactor.com/why-anova-and-linear-regression-are-the-same-analysis/

It seems to make sense for the most part. The only part that is confusing to me is how to get a p-value for each difference between the intercept and the means of each of the categories. Here is the exact quote that is confusing to me:

A regression reports only one mean(as an intercept), and the differences between that one and all other means, but the p-values evaluate those specific comparisons.

How do I get multiple p-values for a single regression analysis? The only way I can think to do this is if I assume each coefficient has a certain distribution, and I compute the p-value of the coefficient for that distribution. Or, is there another way to get p-values that I'm missing?
Glen_b
  • 257,508
  • 32
  • 553
  • 939
makansij
  • 1,919
  • 5
  • 27
  • 38

1 Answers1

4

When you regress on a factor you have an indicator (dummy) variable for each level of the factor bar one (the "baseline" category).

As a result the p-values of the coefficients represent p-values for the pairwise comparisons with the baseline.

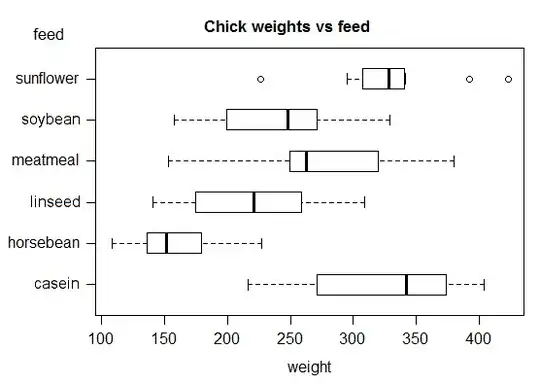
Here's an example in R, a data set on weights of chicks on different feed:

Boxplots of Weights of chicks by feed type

> summary(lm(weight~feed,chickwts))

[... snip ...]

Coefficients:
              Estimate Std. Error t value Pr(>|t|)    
(Intercept)    323.583     15.834  20.436  < 2e-16 ***
feedhorsebean -163.383     23.485  -6.957 2.07e-09 ***
feedlinseed   -104.833     22.393  -4.682 1.49e-05 ***
feedmeatmeal   -46.674     22.896  -2.039 0.045567 *  
feedsoybean    -77.155     21.578  -3.576 0.000665 ***
feedsunflower    5.333     22.393   0.238 0.812495    
---
Signif. codes:  0 ‘***’ 0.001 ‘**’ 0.01 ‘*’ 0.05 ‘.’ 0.1 ‘ ’ 1

Residual standard error: 54.85 on 65 degrees of freedom
Multiple R-squared:  0.5417,    Adjusted R-squared:  0.5064 
F-statistic: 15.36 on 5 and 65 DF,  p-value: 5.936e-10

The last column in the coefficients table is a set of p-values for comparisons with the mean of the baseline (casein) category.

Glen_b
  • 257,508
  • 32
  • 553
  • 939
  • With so many p-values, it seems at risk for multiple comparisons? – makansij Sep 26 '16 at 01:32
  • thank yo. how does `R` choose which variable is the baseline? It seems to me like choosing the baseline would affect the `p-values`. – makansij Sep 26 '16 at 01:39
  • 4
    It does affect the p-values because the p-values represent different comparisons (often you don't care about those particular p-values very much). R uses the first level as baseline (one way to change this is via `relevel`). Some other programs use the last level. Others use still different codings. Whether you worry about multiple comparisons there depends on what you're trying to do. More typically you'd test the factor as a whole and then ether set up some specific contrasts of interest or test all pairwise (when often you would worry about multiple comparisons) – Glen_b Sep 26 '16 at 02:17
  • thanks - what do you mean by "test the factor as a whole" ? Seems to me like `ANOVA` would be better for that... – makansij Sep 26 '16 at 05:50
  • 2
    @Hunle most stats packages would compute the sums of squares for this ANOVA by calculating the regression and finding the contributions to sums of squares from it. – Glen_b Sep 26 '16 at 06:29
  • I do not completely follow your last comment....sorry!! What do you mean by "finding the contributions to sum of squares from it"? – makansij Sep 27 '16 at 04:57
  • 1
    The ANOVA table (at least for fixed effects anova) is generally computed via regression. There's not really a distinction between them calculation wise; it's a matter of what aspects of it are the focus of attention. – Glen_b Sep 27 '16 at 04:58
  • Wow, this just really clicked for me - thanks! And in your first comment, when you said "test all pairwise" you mean to regress the labels separately on each predictor, and conduct either 1.) a t-test for testing the hypothesis $H_o;\beta=0$ 2.) an F-test for testing the hypothesis $H_o;\beta=0$, right? The former of which is shown by `summary(lm(weight~feed,chickwts))`. – makansij Sep 27 '16 at 17:04
  • 2
    No, I didn't quite mean either of those things, but something similar. After a rejection in ANOVA the usual question is "well, if there are differences, what are they?". So testing for pairwise differences would look to see whether $\mu_i=\mu_j$ for all pairs $i\neq j$, but not via new regressions. The estimate of error variance from the original model is used, as are the estimates of the means, so these comparisons are available almost immediately. – Glen_b Sep 27 '16 at 17:56
  • Right. And the pairwise differences could either be tested using `t-test` or `one-way, two-group ANOVA`. And, you're saying that the "estimate of error variance" from the original model is just the SSE reported by `R` from the `summary`. Now, why do we need "estimates" of the means. Don't we know what the means are? – makansij Oct 01 '16 at 19:41
  • 1
    The hypothesis being tested is for a difference in *population means*. We don't know the population means, we estimate them by sample quantities. The relevant quantities are obtained from the original regression to which we can apply our favourite kinds of post hoc multiple comparisons. – Glen_b Oct 02 '16 at 01:58