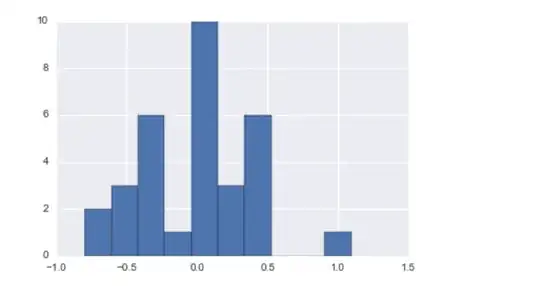
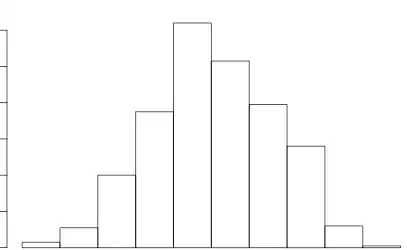
I have a sample dataset where I applied multilinear regression with 4 predictors. To run diagnostics on the model, I generated a residual histogram, residual plot and qqplot.
Both qqplot and residual plot support the hypothesis that data is normally distributed while the histogram is heavily skewed and irregular with missing elements in the generated histogram.
Does this support my assumption that data is normal


