3

I have percentile data (P10, P25, P75 and P90) for a variable.
I also have the mean and median for each group:

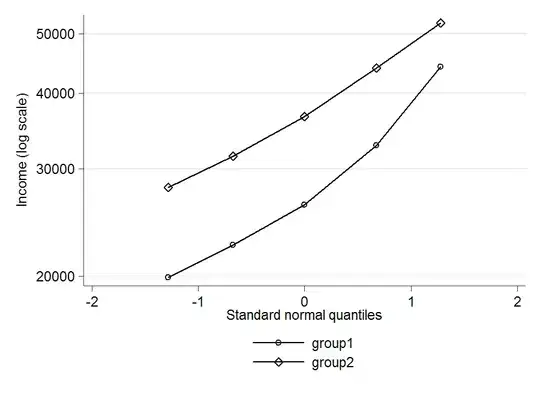
group    mean   median  P10     P25     P75     P90
1        30100  26200   19900   22500   32800   44200
2        38700  36600   28000   31500   44000   52100

How do I:

  1. Create a probability density function based on these variables.
  2. Use that function to give me the % in specific step intervals? (I.e. answering the question: How many out of 100 are in the 30000-31000 interval for group 2?)

Thanks.

dani
  • 143
  • 1
  • 1
  • 6
  • Do you assume any underlying distribution of your variable -- like a normal distribution? – krlmlr Feb 23 '12 at 10:42
  • This is income data per occupation in a single country so I'm not sure what to assume? Thanks. – dani Feb 23 '12 at 11:49
  • Then you'll have to assume a distribution in the first place. Otherwise there's no way to tell which PDF fits the data best. -- Also, isn't P50 supposed to be the same as the median? – krlmlr Feb 23 '12 at 12:09
  • OK, I guess I should assume a normal distribution then? Does that make sense looking at the data? And of course you're right, it should be P75 instead of P50!! – dani Feb 23 '12 at 12:20
  • Then: What is P100, the maximum in each group? Do you have this data? – krlmlr Feb 23 '12 at 12:27
  • Nope, this is absolutely the only data I have, from which I want to draw a curve. – dani Feb 23 '12 at 12:40
  • A very closely related thread appears at http://stats.stackexchange.com/q/6022: it concerns the same problem where only three percentiles are known for data about amounts of government funding, which also has a distinctly skewed distribution. One answer includes clearly-explained working `R` code. – whuber Feb 23 '12 at 15:08

1 Answers1

2

The distributions are clearly positively skewed, so a normal distribution wouldn't be appropriate. Economists often seem to assume that income has a log-normal distribution, so that would probably be a good choice if it fits OK. To check that, you could log the data and then construct a normal probability plot for each group by plotting the logged percentiles (ignore the mean but include the median as the 50th percentile) against the percentiles of a standard normal distribution. If the points lie roughly on a straight line then the log-normal distribution is a reasonable fit. You could then estimate its parameters by fitting a straight line by least squares - that's not the optimal method, but it's simple and probably good enough.

Update: Just tried that myself: enter image description here

Log-normal seems an reasonable fit in group 2, but not so good in group 1. I don't know if it might still be good enough for your purposes. If not you might need to go to some three-parameter distribution, but that could get a fair bit more complicated.

onestop
  • 16,816
  • 2
  • 53
  • 83
  • I couldn't have written this better :-) See [also](http://stats.stackexchange.com/q/6022/6432) [these](http://stats.stackexchange.com/q/12397/6432) [questions](http://stats.stackexchange.com/q/12930/6432). – krlmlr Feb 23 '12 at 13:47
  • Thanks! Great explanation! I think the log-normal will do (is R2 > 0.9 a good indication of this?) Two follow up questions: How do you construct the standard normal quantiles from -2 to 2? And how do I go from these parameters to a density function? Thanks. – dani Feb 23 '12 at 14:08
  • How do you know it's clearly positively skewed without plotting it? – rasen58 Jun 06 '17 at 19:00