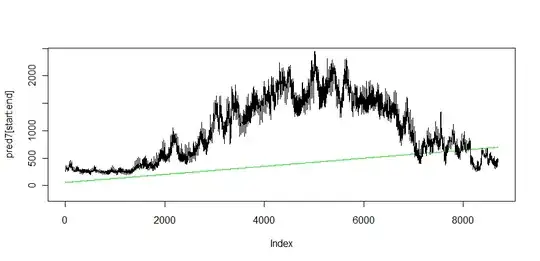
I ran a regression on R and my shapiro wilk test showed that some of my residuals are not normally dsitributed. I cannot transform the data to fit a normal distribution and even when i remove outliers, my data still do not conform? I think this is because there are a lot of zeros and then occasional large numbers which were schools of fish i counted which means my data is quite bizarre. Would love any suggestions.
My response variables are fish density and species richness My predictor variables are all categories, depth (5, 10 and 15m) and site (1, 2 3) and sample method (1, 2).
I also considered doing a wilcoxson signed rank to compare density and richness but I can only do this between the two sites as my other predictors have 3 levels.
Thanks.
