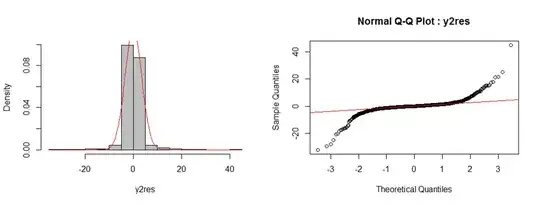
I have decomposed a multimodal distribution into the constituent single distributions for for further analysis. I have spent some time researching various approaches and I have not found one that that is mature and available on CRAN. Currently I have assumed each identifiable mode is the centroid of a Gaussian distribution for which I calculate the SD . I then removed this distribution from the data and repeated the process with the remaining data, this process can be iterative. There are issues relating to estimating the actual SD in the case of significant distribution overlap,and judging distribution symmetry. I attach the data with an example. Whilst the separated single mode distributions make sense within the context of my problem I am very uneasy with the accuracy of the method.Any suggestions would be welcome. I have looked at Stack exchange and not found anything specific.
Asked
Active
Viewed 552 times
1
-
Can you post an example of the problematic case, i.e. with multiple "overlapping" modes? (I am not an R user, but I would be very surprised if there is not a robust Gaussian Mixture Model package available.) – GeoMatt22 Aug 30 '16 at 22:40
-
Sorry, I see you had posted 3 examples, but only the first rendered in-line. Can you say anything more about the data? Sometimes in un-mixing problems it possible to constrain the "pure end-member" distributions by sub-sampling in certain ways. – GeoMatt22 Aug 30 '16 at 22:43
-
@GeoMatt22 I was expecting to find known process and package for distribution extraction from mixed multiple Gaussian distributions but have not succeeded. The three examples have been posted you need to select bottom lefthand side of the image. Additionally the detail of shapes varies with binning as you could expect -- what bin number should you use? – Brianknell Aug 31 '16 at 09:28
-
Histograms tend to be unreliable, due to the [bin sensitivity](http://stats.stackexchange.com/a/51753/127790). There are certainly [many packages](https://www.google.com/#q=gaussian+mixture+R) for Gaussian Mixture Modeling in R. As I do not use R, which is best I cannot say. Typically these are estimated using the [Expectation-Maximization Algorithm](https://en.wikipedia.org/wiki/Expectation%E2%80%93maximization_algorithm#Gaussian_mixture). – GeoMatt22 Aug 31 '16 at 12:57
-
GeoMatt22, first thank you for plugging a hole in my stats knowledge, I knew there would be a way to do this and there are more than one CRAN R module that do this. – Brianknell Sep 01 '16 at 19:12
-
Brian, glad I could help! You can check out the [gaussian mixture](http://stats.stackexchange.com/questions/tagged/gaussian-mixture) tag for more info. – GeoMatt22 Sep 01 '16 at 22:12
1 Answers
1
I used mclust ( Cran package) to extract Gaussian distibutions from the mixture. They are trivariate and the package identified 23 in total. I found this package flexible and easy to use providing repeatable results, ideal for a newcommer.
Brianknell
- 41
- 5
