Great question! Your intuition was good. There is indeed a strong relationship between methods of linear regression and metrics for measuring similarity between a line and a set of points.
The correspondence betwen linear regression and similarity metrics. Here is the relationship. Let $d(\ell,S)$ be a similarity metric that measures the similarity between a line $\ell$ and a set $S$ of points. Then, linear regression is basically the following problem: given a set $S$ of points, find the line $\ell$ that minimizes $d(\ell,S)$. Consequently, each different similarity metrics gives rise to a different flavor of linear regression. And, dually, from any particular flavor of linear regression, you can extract a corresponding similarity metric that the regression method is minimizing.
Notation: if $\ell$ is a line, I will write $\ell(x)$ for the $y$-coordinate on the linear corresponding to $x$. In other words, I'll treat $\ell$ as a function of $x$.
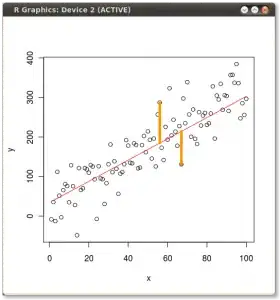
Example 1. Ordinary least squares regression corresponds to the distance measure you mention: namely, $d(\ell,S) = \sum_{(x,y) \in S} (\ell(x) - y)^2$. Thus, for each point in $S$, we consider the vertical distance from the point to the line $\ell$, square it, and take the sum of these squared residuals. Pictorially, we're summing the squares of the lengths of the orange lines in this picture:
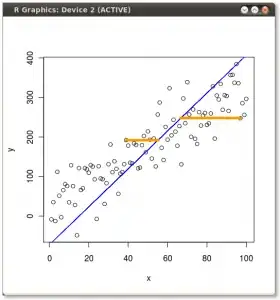
Example 2. If you did ordinary least squares regression, but with the role of $x$ and $y$ swapped, then that would correspond to a slightly different similarity metric: namely, $d(\ell,S) = \sum_{(x,y) \in S} (\ell^{-1}(y) - x)^2$. This corresponds to taking the horizontal distance from each point to the line $\ell$, and summing these squared distances. We're summing the squared lengths the orange lines in this picture:
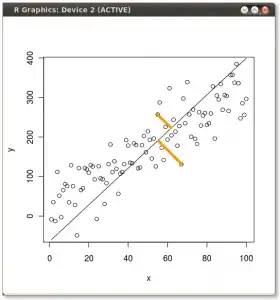
Example 3. If you did principal components analysis (PCA) (also known as orthogonal regression or total least squares (TLS)), that would correspond to a slightly different distance measure, namely, the orthogonal distance from each point to the line $\ell$, squared and summed. Now we're summing the squared lengths of the orangle lines in this picture:
Summary so far. There are many possible similarity metrics. Which one you choose will depend upon the nature of your application and your model for the data.
How to choose a similarity metric. OK, so there are many possible similarity metrics. How should choose which one to use? As already suggested, to answer this, you will need to have some model or hypothesis for how your data were generated.
Ordinary least squares starts from the following model: it assumes that, for each point $(x_i,y_i)$, $y_i$ was generated as a probabilistic (stochastic) function of $x_i$. It assumes the process went something like this: there's some line $\ell$ (not known to us a priori), and given the input $x_i$, we first calculate $\ell(x_i)$ (the $y$-coordinate on the line corresponding to $x_i$), then we randomly generate some noise/error value $e_i$ from a normal distribution with mean 0 and standard deviation $\sigma$ (where $\sigma$ is not known a priori), and then we set $y_i = \ell(x_i) + e_i$. Since each $e_i$ is assumed to be iid Gaussian, a reasonable measure of how closely a hypothesized line $\ell'$ fits this model is to take the sum of squares of the inferred $e_i$ values. For the correct line $\ell$, we will have $d(\ell, S) = \sum_i e_i^2$, which has expectation $n \sigma^2$. For an incorrect line $\ell'$, we will have $d(\ell', S) = \sum_i (e_i \pm \ell'(x_i)-\ell(x_i))^2$, which has
expectation $n \sigma^2 + \sum_i (\ell'(x_i)-\ell(x_i))^2$, which you might notice is larger than the expectation for $d(\ell, S)$. In other words, starting from a particular stochastic model for how the data was generated, OLS uses a particular distance measure that is well-suited to testing how closely the observed data fits the presumed model.
Of course, this is not the only plausible model for how your points might have been randomly generated (as a function of the line $\ell$). Given a different process, we might end up with a different similarity metric.
Hypothesis tests. Finally, let me mention one more topic that you didn't bring up, but you could have. Let's say you have a stochastic model for how your points were randomly generated. Let's say that the line $\ell$ is the parameter of this random process. Then another interesting question we could ask is: given the observed set of points $S$, test the hypothesis that the points $S$ came from the aforementioned random process, using line $\ell$ as parameter. One could work out a way to compute a $p$-value for the likelihood that $S$ were generated according to that distribution. If the $p$-value is very small, you might reject the hypothesis that the points were generated from this particular random process with parameter $\ell$ (roughly speaking, this would amount to saying that the points $S$ don't seem to correspond to the line $\ell$). If the $p$-value is not too small, you might proceed as though the hypothesis is potentially true (roughly speaking, this would amount to saying that the points $S$ are consistent with the hypothesis that they came from your random model with line $\ell$). So, hypothesis tests might be another way to, very roughly speaking, measure whether the points seem to be consistent with any particular line.
Credits. I gratefully acknowledge @JD Long for these excellent pictures. See also his answer explaining different forms of regression for more insight.