-1

First of all, this might makes zero sense, I pretty much don't know anything about statistics and i'm not a native english speaker to make things harder.

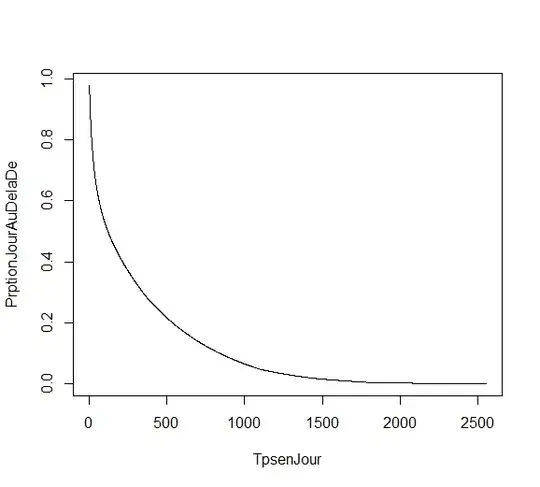
I have a few sets of data that are very similar where, I have some ratio* in the Y-axis and the time in days in the X-axis, I'm trying to do a regression on it. Here is what the plot looks like :

*The data is about sick leaves and I study their durations, the ratio is actually : the number of sick leave's days that happen beyond the x-th day divided by the total number of sick leave's days. (For instance if i have 3 leaves that are 2, 8 and 10 days long : the ratio for day 5 is (3+5)/(2+8+10)=0,4)

enter image description here

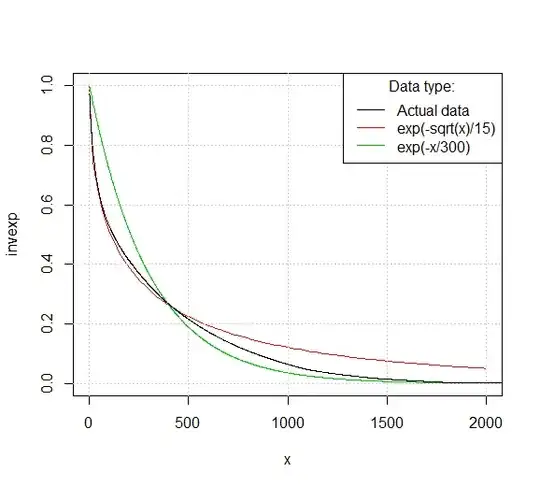
So here is what I did, I tried to find what kind of data this looks like to make a regression afterwards and get my coefficients. I thought it looked like the inverse of an exponential function so i compared it to that, and here is what I got :

enter image description here

What i wanted to do afterwards was to compare the coefficients of each sets of data that I have to be able to tell how different they were.

I dont know if there is any point in what I'm trying to do so if I need to be more specific about some things please tell me to.

To explain the situation more specifically, here is what I'm trying to do, I'm in an internship and I've been asked by an actuary to find a way to prove wether or not there is a "statistical difference" between those different sets of data that I have. The problem is that I find that a bit vague and I don't know exactly what to do. I asked advice to a statistician, who wasn't sure of what was expected but he hinted that I should look into linear regression.
PaoloH
  • 263
  • 2
  • 9
  • 2
    The procedure described at http://stats.stackexchange.com/a/35717/919 appears to apply directly to your situation. It is so simple you can even figure out reasonable linearizing transformations of your variables with pencil and paper. – whuber Aug 17 '16 at 13:30
  • The issue that i have with their procedure is that I don't know what i'm supposed to change besides the datasets ,obivously, to adapt their functions to my situation. – PaoloH Aug 17 '16 at 14:19
  • What is the nature of the ratio in your y variable? Is it a ratio of two continuous variables, or is it something like counts/hour or success/trials? – Eric Scott Aug 17 '16 at 15:17
  • I added the explanation of what the ratio exactly is. – PaoloH Aug 18 '16 at 07:50

1 Answers1

0

What you want to do: "..To compare the coefficients of each sets of data that I have to be able to tell how different they were*."

So the question is, how do you figure out the coefficients? The dataset is obviously not linear, in other words the model have variables with an exponantiation higher than 1 e.g x^2+x+5=y

You can find out the coefficients with Newton's method - there are many resources on how to do it. There are certainly packages in matlab/R.

You also want to find out which model is the better one: the red or the green one with respect to the actual data, yes? You can compare and evaluate how good the model is by calculating the Root mean square error (RMSE) of each model and pick the model with the least RMSE.

Did this answer your question?

Lennart
  • 348
  • 1
  • 10
  • That's pretty much what my question was, the RMSE seems to be exactly what I was looking for to compare models. But just to make sure I understood the first part though, you think i should use the Newton's method to find a polynomial model instead of an exponential one ? Or maybe take the log first and use Newton's method on that ? – PaoloH Aug 18 '16 at 09:17
  • See it like this: when we get a data set and have no idea how the data looks like (i.e linear, exponential etc) then one can use different methods (i.e Newton's method) to figure out how it looks by constructing a model from the data points. If you know that the data you've received is in fact exponential, go for it and try different exponential models and compare them. If you're not sure, compare the models you get from Newton's method as well. – Lennart Aug 18 '16 at 09:24
  • Ok, the exponential model was just a guess so I'll start with Newton's method. That was very helpful, thank you. – PaoloH Aug 18 '16 at 09:28
  • An easy way to calculate coefficients and try different methods is with https://mycurvefit.com – Mister Cook Aug 28 '16 at 20:38