1

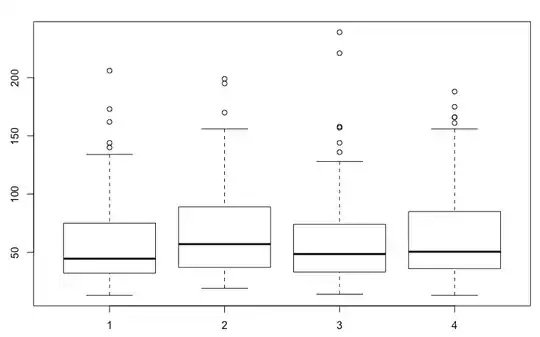
I'm struggling with the data of an experiment in an online shop. Participants were presented with a picture of an item available in the shop and asked to browse trough the different categories and add the correct item into the shopping cart. The variable of interest is task completion time (i.e. how long it took participants to find the item and add it to the cart). I have four groups (different versions of the shop). As you can see in the boxplots, the distribution of completion times is right skewed and there are a bunch of outliers in all four groups.

enter image description here

I have tried several different ways - and combination of these - to account for the non-normal distribution and the outliers, which all lead to different results:

  • Trimming of Outliers
  • Winzorization (i.e. setting most extreme values to 95% percentile)
  • Log-Transforming the data

Eventually, I want to be able to perform an ANOVA. In your opinion, which method for the analysis of completion time data is the most appropriate and are there other ways, which I have not mentioned?
mathi164
  • 53
  • 3
  • Do you have any repeated measurements in your setup? Were there a fixed set of people interacting with each store version? – Todd D Aug 14 '16 at 15:56
  • No, I have no repeated measure. The participants were randomly assigned to one of the four layouts. – mathi164 Aug 15 '16 at 07:52

1 Answers1

1

I believe that your data would best be analyzed using, in order of preference, a time-to-event method such as Kaplan-Meier or Cox's model or, less optimal, a Poisson regression.

Provided that you are interested in the differences in time until completion, survival analysis will give you the best sense of the difference between completion rates of your groups. The main role of survival analysis is to understand differences in an underlying process ( the "force of mortality" in healthcare applications) leading some units to fail (or not fail) deferentially as a function of time. Survival analysis takes into account that not all units are under observation at all time points in the analysis- some have already failed or, in your case, completed the task. This is called censoring. Your analysis may not succeed in identifying differences in the underlying completion rate at any given time if you do not account for the fact that some persons have already completed the task. Thus, one of the methods of survival analysis is most appropriate. Also, skewness is often seen in survival analysis and, as long as the proportional hazards assumption is met, survival analysis is particularly well-suited to handle this skewness, while still preserving the ability to differentiate between rates over time between groups or covariates.

Poisson regression can also be used to model failure time data under special circumstances (see: Does Cox Regression have an underlying Poisson distribution?). However, it has never been clear to me why this offers an advantage over survival analysis, as this method requires the data fits the Poisson distribution and does not account for changing membership in the at-risk group over time.

Todd D
  • 1,649
  • 1
  • 9
  • 18
  • Thanks a lot. Your suggestion seems very legit and helped a lot! Out of interest: Would it be possible to add a repeated measure to these kinds of models as well? I had three very similar tasks in my experiment and thought it would be interesting to introduce the task variable in the model as well. – mathi164 Aug 23 '16 at 10:55
  • Yes, there are many ways to proceed when considering repeated measures or situations where the underlying hazard may be more uniform by group. The easiest method is stratification, which will allow each strata to have its own baseline hazard while "averaging" the covariate effects. Secondly, look into use of "sandwich estimators" and frailty models for further treatment of repeated measures. – Todd D Aug 23 '16 at 15:50