1

I have roughly 15,000 non-independent features for each of which I have a sample size of 100. For each of these feature-sample data points, I have a value of TRUE or FALSE corresponding to some status of the feature, such that for each feature, I have 100 TRUE or FALSE values.

How can I test the "trueness" of each feature and thereby determine the percentage of features with a significant TRUE value? A suitable null hypothesis may be that the feature does not have a TRUE status. My problem though is that an $\alpha$ of 0.05 corresponding to a rejection of the null hypothesis if there are >95 TRUES for a feature, seems too high. I have no reference dataset by which to make a comparison.
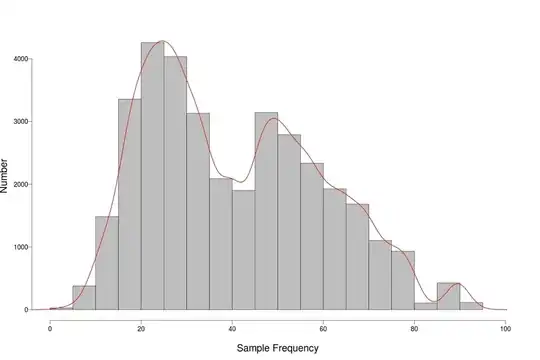
enter image description here


UPDATE: Re: Use of Fisher's exact test.

I am not sure what parameters to use for the 2 x 2 contingency table using Fisher's exact test or chi-squared test. What would class 1, class 2, sample 1 and sample 2 be? 'TRUE count', etc.? Here are the first few rows and columns of the data:

          Sample1 Sample2 Sample3 Sample4 Sample5 Sample6 Sample7 Sample8 Sample9 Sample10
Feature1    TRUE    FALSE   TRUE    FALSE   TRUE    TRUE    FALSE   TRUE    FALSE   FALSE
Feature2    TRUE    FALSE   TRUE    FALSE   TRUE    TRUE    FALSE   TRUE    FALSE   FALSE
Feature3    TRUE    FALSE   TRUE    FALSE   TRUE    TRUE    FALSE   TRUE    FALSE   FALSE
Feature4    TRUE    FALSE   TRUE    FALSE   TRUE    TRUE    FALSE   TRUE    FALSE   FALSE
Feature5    TRUE    FALSE   TRUE    FALSE   TRUE    TRUE    FALSE   TRUE    FALSE   FALSE
Feature6    TRUE    FALSE   TRUE    FALSE   TRUE    TRUE    FALSE   TRUE    FALSE   FALSE
Feature7    TRUE    FALSE   TRUE    FALSE   TRUE    TRUE    FALSE   TRUE    FALSE   FALSE
Feature8    FALSE   FALSE   TRUE    FALSE   TRUE    TRUE    FALSE   TRUE    FALSE   FALSE
Feature9    FALSE   FALSE   TRUE    FALSE   TRUE    TRUE    FALSE   TRUE    FALSE   FALSE
Feature10   FALSE   FALSE   TRUE    FALSE   TRUE    TRUE    FALSE   TRUE    FALSE   FALSE
Feature11   FALSE   FALSE   TRUE    FALSE   TRUE    TRUE    FALSE   TRUE    FALSE   TRUE
Feature12   FALSE   FALSE   TRUE    FALSE   TRUE    TRUE    TRUE    TRUE    FALSE   TRUE
Feature13   FALSE   TRUE    TRUE    FALSE   FALSE   TRUE    TRUE    TRUE    FALSE   TRUE
Feature14   FALSE   TRUE    TRUE    FALSE   FALSE   TRUE    TRUE    TRUE    FALSE   TRUE
Feature15   FALSE   TRUE    FALSE   FALSE   FALSE   TRUE    TRUE    TRUE    FALSE   TRUE
jonsca
  • 1,790
  • 3
  • 20
  • 30
tombryna
  • 13
  • 3
  • What percentage of your features have 100 TRUE values? If 0%, have a look at 99 and 98. – Michelle Feb 14 '12 at 04:29
  • None of them have 100 TRUE values. The highest is 96. But at what point can deem that the number of TRUE values is significant? – tombryna Feb 14 '12 at 07:45
  • The significance will need to be derived from your data. If you plot a histogram of the percentage of TRUE values, is there any kind of little peak at the top end of percentages that may suggest a grouping separate to the others? What does the distribution of % TRUE values look like? – Michelle Feb 14 '12 at 08:16
  • What do you mean by "significant"? For example, what hypothesis would you reject, when you found a feature to be significant? Without this I don't think we can help, beyond suggesting simple summaries. – guest Feb 14 '12 at 09:17
  • Added a link to a histogram and a potential null hypothesis but without a specific level of significance – tombryna Feb 14 '12 at 09:33

1 Answers1

0

What you could do is test whether some features have significantly more trues than others (or than the average). This would be Pearson’s Chi-Squared test or Fisher’s exact test.

Edit: Note that this approach somewhat contradicts your initial question, as it constructs a comparator. However, the very idea of a statistical test requires comparison.

mzuba
  • 1,078
  • 8
  • 24
  • What are the relative merits of Pearson's vs Fisher's? Also, I'm thinking that the median would be the best central measure to use. Any argument against using the median? Thanks. – tombryna Feb 14 '12 at 11:25
  • 1, see for example [this](http://stats.stackexchange.com/questions/14226/given-the-power-of-computers-these-days-is-there-ever-a-reason-to-do-a-chi-squa) discussion for merits of χ² versus Fischer’s exact test. In most cases, they will produce identical results. 2, both the median and the average are somwhat arbitrary choices of comparisons. Keep in mind that what you can say about your data depends on what you test. – mzuba Feb 14 '12 at 12:03
  • In light of that link, do you think a resampling technique like a permutation test may be suitable? – tombryna Feb 14 '12 at 12:20
  • In this case, Fischer’s exact test would be the permutation test. Both Fisher’s exact and χ² are suitable. – mzuba Feb 14 '12 at 12:38
  • Updated question. Not sure how to use Fisher's exact test for data. – tombryna Feb 15 '12 at 22:49
  • 1
    In response to your question about alpha level, I think an FDR correction is in order, since you say the features are dependent on each other. This should substantially lower your Type I error rate. – Jeff Feb 15 '12 at 22:57
  • Yes I'll have to look into doing something about that. Do you have any ideas re using Fisher's exact test for the data? – tombryna Feb 15 '12 at 23:25
  • Which statistical package are you using? – mzuba Feb 16 '12 at 09:39
  • Excel but I can switch to R if needed – tombryna Feb 16 '12 at 10:46
  • [Save your excel sheet as csv file](http://pcunleashed.com/excel/how-to-save-your-excel-spreadsheet-as-a-csv-file/). Import data from excel to R using [read.csv()](http://www.cyclismo.org/tutorial/R/input.html#read). Learn how to select the relevant data from the resulting [data frame](http://www.evc-cit.info/psych018/r_intro/r_intro4.html). Compute fisher’s exact test using [fisher.test()](http://darwin.eeb.uconn.edu/eeb348/supplements-2006/chi-squared/chi-squared.html). Compare the p-values of the Fisher’s exact test with FDR-corrected values. – mzuba Feb 16 '12 at 13:49