You are interested whether two or more pairs of candidates' votes differ in their distribution. The alternative (null hypothesis) to that is that no two pairs are different, that is, all are the same. As user etothej has nicely illustrated before, a simple omnibus test of differences in responses is the $\chi^2$-test. In R-code:
x <- c(345,52,70)
chisq.test(x)
which gives us a significant result
Chi-squared test for given probabilities
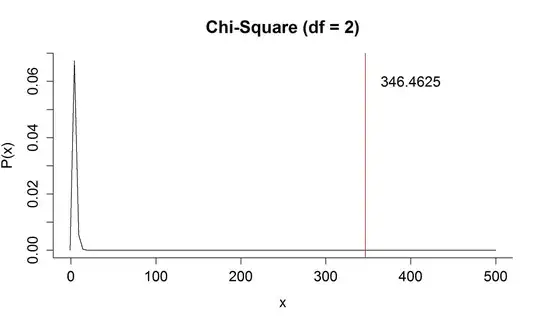
data: x
X-squared = 346.46, df = 2, p-value < 2.2e-16
Again, the null hypothesis states that the distribution of the votes are the same for each president. With a significant result, we are willing to reject this null hypothesis. Now, we still do not know which of the pairs do really differ. By inspection, it looks like the first (345 votes) president received a lot more votes than the others. But specifically testing this difference is not a proper confirmatory test anymore because we now have peeked at the data. To get an unbiased valid inferential result, we must really look at all pairwise comparisons and correct for multiple testing (unless you had suspected and hypothesized that president A is getting most votes before collecting the data). The so-called Marascuilo procedure enables us to simultaneously test the differences of all pairs of proportions while correcting for multiple comparisons. I have not found an R implementation, so I provide my own here:
p <- x/sum(x)
N <- length(x)
crit <- qchisq(0.95,length(x)-1)

# prepare storage of results
result <- data.frame(matrix(NA, nrow=(N^2-N)/2, ncol=5,
                 dimnames = list(NULL,c("i","j","statistic","crit.value","significant"))))

# iterate over all pairs with (i,j)
idx <- 1
for (i in 1:(length(p)-1)) {
  for (j in (i+1):length(p)) {
    stat <- abs(p[i]-p[j])
    rcrit <- sqrt(crit) * sqrt( p[i]*(1-p[i])/x[i] + p[j]*(1-p[j])/x[j]  )
    result[idx, ] <- c(i,j, round(stat,2),round(rcrit,2), ifelse(stat>rcrit,"yes","no"))
    idx<-idx+1
  }
}
To briefly explain this code: With the two for-loops, we iterate through all combinations of pairs and calculate a test statistic stat as the absolute difference of proportions and a critical value, rcrit for each of the pairs. Each statistic exceeding the critical value is denoted significant. The results are stored in a data.frame.
For your example, we get
print(result)

  i j statistic crit.value significant
  1 2      0.63       0.12         yes
  1 3      0.59       0.12         yes
  2 3      0.04       0.15          no
From this, we can obtain that the pairwise differences of (1,2) and (1,3) are significant but we found no significant difference between (2,3).
The Marascuilo procedure is explained in Marascuilo (1966) and – more comprehensively – Marascuilo & McSweeney (1977, p. 141-147).
- Marascuilo, L. A. (1966). Large-sample multiple comparison. Psychological Bulletin, 65(5), 280-290. doi:10.1037/h0023189
- Marascuilo, L. A., & McSweeney, M. (1977). Nonparametric and distribution-free methods for the social sciences. Monterey, CA: Brooks/Cole.