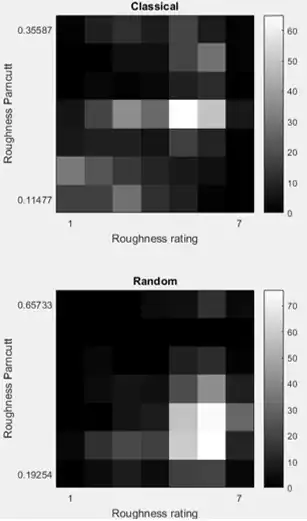
I have a bunch of 2D distribution/histograms that represent variable X against variable Y, across several conditions. The histograms look something like:
For each condition (each data summary as displayed above), I would like to calculate some measure of "statistical significance" using permutation testing. But I'm not sure how.
Someone suggested doing something like: compute a relevant DV for each distribution (which one?!), then randomly shuffle the data and recompute the DV .. do that 10,000 times to obtain the distribution, then compute the p-value for the original DV on the basis of that distribution.
Can anyone suggest/clarify how this can be done?
