I have a vector of parameters $\theta=(n,ph,pt,\gamma)$ which are fed into a process which produces a result. I would like to quantitatively report the sensitivity of the result to the variation of a parameter(s). Univariate correlation isn't what I'm after because $\theta$ is sampled from a distribution. What do you think is my best bet? Let me know if more information is required.
Thanks.
EDIT
The process is stochastic. Basically a person moves round a room touching surfaces (n times) stochastically, based on observed probabilities. By touching each surface they pick up an isotope with probability $\gamma$ . How much isotope they pick up depends on a variable pt, calculated experimentally.
After they finish touching surfaces, they wash their hands with probability and efficacy (ph).
Therefore the output is a scalar quantity of isotope and a vector of surfaces touched.
EDIT 2
The isotope ($I$) on the person's hand is calculated in an additive manner after each surface contact so:
$$I=\lambda_i \, pt_i V_i$$
Where $V_i$ is the surface concentration of isotope. Let's assume we're dealing with one surface so $V$ is constant. Then the total sum of isotope on the person's hand after $n$ touches with the same surface would be:
$$I=\sum_{i=1}^n\lambda_i \, pt_i V_i$$
They then wash their hands with some efficacy $ph$.
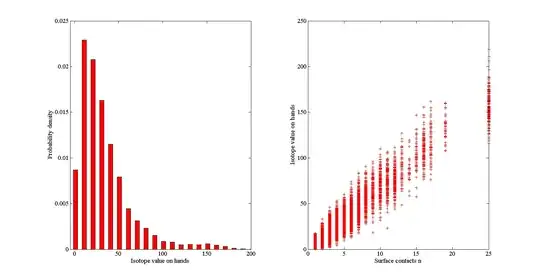
The left hand picture is a frequency density histogram of $I$. The right hand picture is a scatter graph between $I$ and $n$.
However $n$ is drawn from a distribution of observed data. How can this be incorporated into sensitivity analysis?