1
  1. The following table gives data on income in thousand dollars (x), the number of families (N) at income x and the number of families owning a house (n).

       x    10  13  15  20  25  30  35  40
       N    60  80  100 70  65  50  40  25
       n    18  28  45  36  39  33  30  20
    

Suggest an appropriate regression equation to explain the effect of income on owning a house. Also estimate the parameters of this equation using the above data and predict therefrom the proportion of families at income 32 thousand dollars who own a house.

For this problem I am using Logistic regression. I tried to find $p_i=(n_i/N_i)$ then $Y=\ln(p_i)-\ln(1-p_i)$. Do I have to work with frequency to find mean(y) and mean(x)? Then how can I estimate 'a' and 'b'?

And if possible give some links where I can find this kind of problems.
gung - Reinstate Monica
  • 132,789
  • 81
  • 357
  • 650
  • I dont know how to estimate 'a' and 'b'. i have found (pi)=ni/Ni then Y=ln(pi)-ln(1-pi). Do i have to work with frequency. I have not done this kind of problem before. I have searched . They are using R or Excel. –  May 28 '16 at 15:50
  • Thank you for adding the tag & telling us what you've tried. This question now meets our standards & does not need to be closed. – gung - Reinstate Monica May 28 '16 at 16:33

1 Answers1

2

You've got some good ideas, i'll try to push you along a bit in the right direction.

In this kind of simple situation, your first instinct should be to make pictures! A good plot can really point you in the right direction. To that end, i'll put your data into R

df <- data.frame(
    x = c(10,  13,  15,  20,  25,  30,  35,  40),
    N = c(60,  80,  100, 70,  65,  50,  40,  25),
    n = c(18,  28,  45,  36,  39,  33,  30,  20)
)

A decent suspicion is that a higher frequency of families will own a house when their income is higher, let's look. I'll calculate the frequency that a family in a certain income bracket owns a house, and the log odds of that frequency

df$rate <- df$n / df$N 
df$logodd <- log(df$rate / (1 - df$rate))

and then make a simple plot

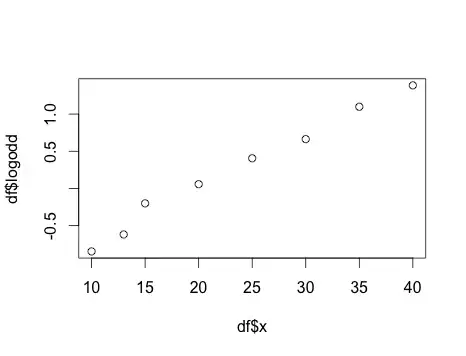
plot(df$x, df$logodd)

enter image description here

This is quite suggestive that the log odds of owning a house increases as a linear function of income.

You mention R, so you're going to want to study the glm function, setting the family to "binomial" for logistic regression. I don't want to give away the whole thing, as checking the documentation and figuring out how to fit the model is a really important skill. Try ?glm to get yourself started.

Matthew Drury
  • 33,314
  • 2
  • 101
  • 132
  • 2
    (+1) But If the OP is new to logistic regression, & not just to `glm`, one of the references suggested at [What is the best book about generalized linear models for novices?](http://stats.stackexchange.com/q/69521/17230) [Reference Request: Generalized Linear Models](http://stats.stackexchange.com/q/94371/17230) would be a better place to start than `?glm`! – Scortchi - Reinstate Monica May 28 '16 at 21:03