1

I have a sample of acquisitions 1994 to 2015. When I run an linear multiple regression with the cumulative abnormal return after the announcement my coefficient of interest (HFA_dummy) is statistical significant. However, when I split my sample in subsamples from 1994 to 2007 and 2008 to 2015, my coefficient is insignificant for both regressions.

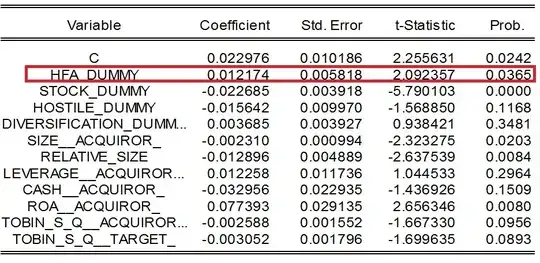
Full sample: Full sample

From 2008: enter image description here

For before 2008 the HFA_dummy has a t-statistic of 1.38 and a p-value 0.1656. (I can't post the picture because this is my first post and I can only post two links)

Can it be a sample size issue? For the full sample I have N=2244 for which the dummy is 1 in 263 cases. For the 1994 to 2007 subsample I have N=1581 and 151 cases and for the 2008 to 2015 subsample N=663 and 112 cases.

Is the reason maybe that also the significance of my control variables changes substantially?

Also, my residuals are non-normally distributed, can this cause the problem?

Any help is highly appreciated!

Vikingking
  • 13
  • 1
  • 5
  • 2
    When you say "multivariate" regression, is it possible you really mean "multiple regression"? "Multivariate" regression is used when we have more than one *dependent* variable, but it sounds to me like you have more than one *independent* variable. – Silverfish May 02 '16 at 23:33
  • 3
    @Vikingking Statistical significance is partially a function of sample size. With a big enough sample, you can detect tiny differences. When you cleave your sample in two, you reduce that ability. – dimitriy May 03 '16 at 00:05
  • 1
    The actual results of your statistical tests would help determine whether the issue is sample size or some systematic difference between the two time periods. Also, regressions of time series can be tricky. More details would help in suggesting answers. – EdM May 03 '16 at 01:41
  • How significant is it in the full sample? – Matthew Gunn May 03 '16 at 02:04

1 Answers1

1

Your analysis results essentially answer your question. Much is from the smaller number of cases, but the lack of normally distributed residuals means that the p-values are not reliable, and there is evidence that your model is not yet specified well enough.

The point estimate of your coefficient of interest is the same to two significant figures in both the full and the post-2007 subset: 0.012. Its standard error is higher in the subset, so the t-statistic is lower in magnitude and is no longer "significant." You will notice that most other coefficients also have larger standard errors in the subset.

So why are the standard errors higher? The formula for the standard error of a coefficient depends on the number of cases. Same coefficient value, fewer cases, higher standard errors, no longer "significant."

In any event, the lack of normality in your residuals calls into serious question the validity of the statistical tests. You might still have reasonable point estimates of the coefficients, but without normally distributed residuals independent in magnitude from the predicted values you can't trust the p-values at all.

Next, look carefully at all of the coefficients. You will notice that the "Stock_Dummy" and "Relative_Size" coefficients depart even more dramatically from "significance" in the post-2007 subset. This suggests that there may be some fundamental difference between the entire dataset and its post-2007 subset that your model does not capture. Think about what happened to the world economy in 2008.

Work on refining your model to get better-behaved residuals and (possibly) to account for the different economic world since 2007. It's not clear that you will then get "significance" for your coefficient of interest in the post-2007 subset, but if you are building a predictive model then it can be a good idea to include all relevant predictors even if they do not meet some arbitrary cutoff of "statistical significance."
EdM
  • 57,766
  • 7
  • 66
  • 187
  • 1. Follow up question: I initially thought I wouldn't have to worry to much about the non-normality of the residuals due to central-limit theorem as my sample is relatively large. Do I understand you correctly that my regression results indicate that the central-limit theorem does not hold for my sample and I can not interpret the t-statistic/p-values for both my full and my subsamples? – Vikingking May 04 '16 at 22:10
  • 2. Follow up question: I chose the cutoff in 2008 by purpose as I expected different situations pre- and post-crisis. However, what I found puzzling was the missing significance in both subsamples. I additionally seperated the sample into three subsamples. For the three subsamples I found again a non-significant coefficient of interest for two of the subsamples but a significant coefficient for one of the subsamples. Would this result make sense or is it also not interpretable due to the non-normality? Would a Chow test make senes in my case or would the non-normality flaw the test? – Vikingking May 04 '16 at 22:21
  • Why do you care so much about nominal statistical significance? Chasing _p_values is not always the best idea. Say more about your audience. – EdM May 04 '16 at 22:46
  • Basically I test the hypothesis whether the HFA_dummy has a positive effect on bidder performance (cumulative abnormal return). Therefore, I mainly care about the statistical significance of the coefficient. The regression is part of a master thesis in finance. – Vikingking May 04 '16 at 23:41
  • The central limit theorem may lead to near-normality around any particular predicted value, but in a case like this it won't help with non-linearity or other issues that make error magnitudes depend on the predicted value. This shows up as non-normality when you consider all residuals together. In that case neither the multiple regression tests nor the Chow test will provide reliable _p_-values. As a student you should be able to get help from faculty on this. The loss of significance with subsetting may be unavoidable. Including dummy variables for subsamples in a complete model might help. – EdM May 05 '16 at 00:26