2

Not that strong in statistics, so I need a little help getting started with some data I've gathered.

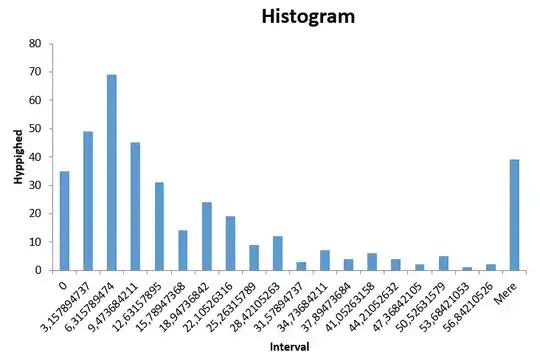
In my experiment subjects had to perform tasks while I took time for them to complete it. Now, I want to do some t-testing based on various parameters, but.. My data ranges from 0 to 60 seconds. The experiment stopped at 60 seconds, so about 7-8 % of the data is '60'. Same amount around 0 seconds. Rest is highly skewed towards right with an overall mean time at 16,89 seconds.

So my question is: Can I do a t-test on this, when the data is so skewed? If not: What test can I do to check if groups/parameters has an effect?

I also have two different groups with an assumption that they're different (p < 0.05), but same problem again. The data is not normalized.

Could a Mann-Whitney U test be suitable for this?

Sample size: ~380

I've attached a picture of the histogram. X-values is time, Y-values frequency.

enter image description here

I've tried to do a log10 transformation. Before that I removed the 60's, since those are not actual times of completion. When I do the log10 then the first group (sample size ~380) is somewhat normalized:

http:// imgur. com/XDEv74V

But the group for which I try to do the t-test is not (sample size 52):

http:// imgur. com/pfrAV8H

(cant upload 2+ pictures due to reputation < 10)

The two-tailed t-test of difference in variance gives a p-value much lower than 0.05. But can I count on this being correct on a log10 with only one of the samples being "normalized" ?

I've done the wilcox.test (Mann-Whitney-Wilcoxon test) in R and i get the following results:

Rank: W = 13840, p-value = 0.001673

Signed: V = 895.5, p-value = 0.5861

What's the difference between rank and signed?
Msjohansen
  • 35
  • 4
  • It will be useful if information about objecives and study design is indicated including sample size s and parameters. –  Apr 25 '16 at 11:10
  • You said that 7 to 8% of your data are 60 but your histogram has no one at 60 – Peter Flom Apr 25 '16 at 12:07
  • I included the wrong histogram, now the correct one is uploaded. I excluded the 60's because that's when I stopped the subject due to the time limit of 60. It's displayed as 'Mere' here – Msjohansen Apr 25 '16 at 12:13
  • This question might be related to : http://stats.stackexchange.com/questions/110801/should-i-use-t-test-on-highly-skewed-data-scientific-proof-please or http://stats.stackexchange.com/questions/69898/t-test-on-highly-skewed-data. – A Gore Apr 25 '16 at 12:50
  • Your data are [right censored](https://en.wikipedia.org/wiki/Censoring_%28statistics%29) at 60. You can't simply ignore that issue by treating them as being the same as an observed time of 60, nor can you omit those observations. – Glen_b Apr 25 '16 at 16:42
  • Right censored data is something I haven't heard of before. Thank you for pointing that out. How would I deal with this? I've searched for it, but the majority of the sites explain the concept without proposing solutions to right censoring. – Msjohansen Apr 25 '16 at 19:39

1 Answers1

0

This is basically a failure time model. Subjects who did not complete the task by 60 seconds are right-censored (you know it took them longer than 60 seconds to finish but you do not know how long it would have taken them).

This can be modeled using log-rank tests, accelerated failure time models, proportional hazards, etc. Standard graphical presentation is the Kaplan-Meier curve (survival curve).

You could also do a conditional analysis. Analyze the effect of the predictors on the chance of success in 60 seconds. Then analyze the effect of the predictors on those who did succeed 60 seconds. I would recommend one of the models above, however.

StatNoodle
  • 659
  • 3
  • 6
  • So, if I were to use the proportional hazard model (Cox's) I would do it like this?: Time: the time datapoints in my data (how long it took them to complete the task - from 0 to 60) Event indicator: The censoring (0 for < 60 and 1 for 60) Variable: Group (is it group 1 (sample 380) or group 2 (sample 52)) Then run the Cox with those parameters and see if the group variable gives a p < 0.05? Is it "that easy" ? – Msjohansen Apr 26 '16 at 11:20
  • That sounds right to me. – StatNoodle May 03 '16 at 22:02