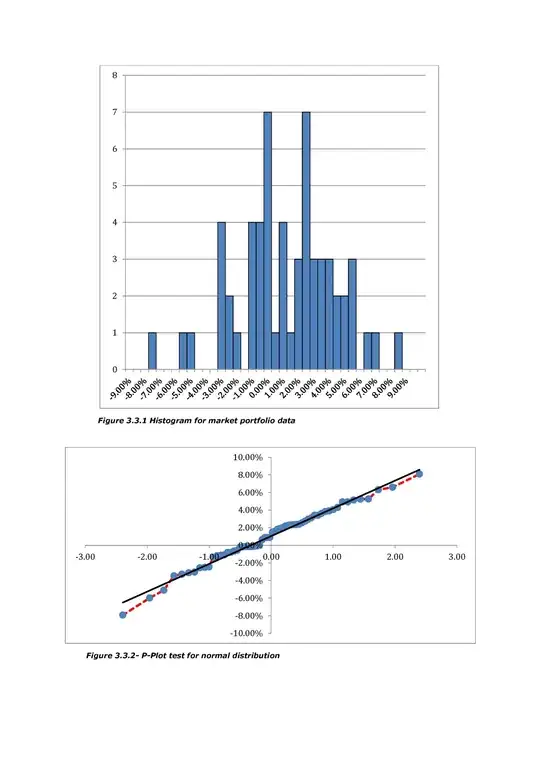
I am currently undertaking a hypothesis test for some financial returns data. I'm getting slightly confused on parametric versus non-parametric testing. I am testing a market portfolio of 305 stocks against test portfolios of various sizes (9 portfolios ranging from 16 to 86 stocks). I am trying to show that portfolios can beat the market, so running a null hypothesis that the market portfolio = test portfolio. I have assumed the data is normally distributed so have used a t-test for paired data.
This has provided a set of results. Problem is I'm not sure the data is normally distributed. I have built a histogram and a p-plot (attached), one looks normal(ish) the histo looks bimodal so I'm thinking the data isn't normally distributed. So I have turned my focus to a Wilcoxon signed rank test and have generated t-test statistics for each portfolio. Problem being, I can't find critical values for anything about 30 samples, I have 60 so it may not be the answer either.
In short my questions are: -
- Do I just check the population for normality or the sample as well before I can use any of the parametric tests?
- If the data isn't normal, is Wilcoxon the approach to take?
- If it is the approach, where do I find data for a sample size of 60?
It's probably also worth mentioning, I don't have SPSS or any stat software, only Excel so I am a bit limited.
