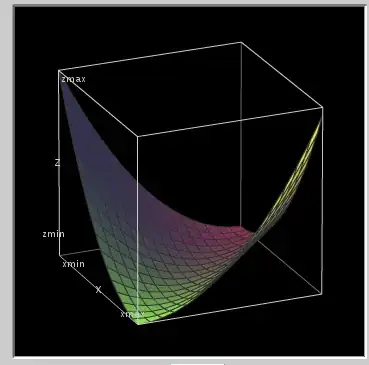
I know that linear regression leads to a convex optimization problem. I'd like to visually show this with a simple example. Assume that there are two parameters (x and y) and a single data point <1, 1> with 2 as the y value (no intercept term. Then the cost function becomes
$$ (x+y-2)^2 $$
However if you plot this function you will get the figure
 which contains more than one minimal point.
Where is the problem in this example?
Thanks