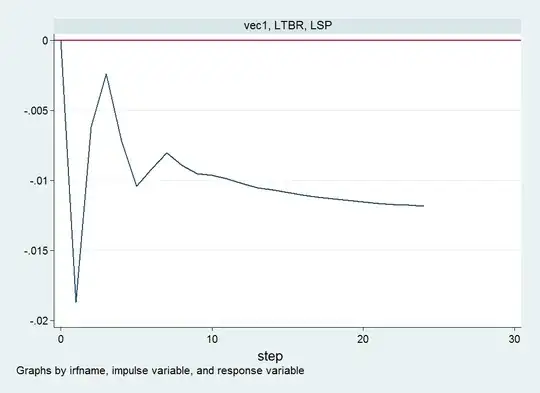
I have plotted IRF in stata with response S&P500 and impulse treasury bill rate. According to the model they are positively related. However, my irf graph is below zero(see the graph below). How do I interpret such a result?
Asked
Active
Viewed 2,153 times
4
-
Is the actual problem in reading the graph or in reconciling what you think is implied by the model with what you see in the graph? – Richard Hardy Mar 26 '16 at 21:39
-
The problem is with reading the graph – Mansur Apr 05 '16 at 13:25
-
Well, the graph shows impulse responses (literally). What is exactly the problem? – Richard Hardy Apr 16 '16 at 14:13
1 Answers
1
Shock to t-bills results in a negative response in S&P500. It could be that higher t-bill rates depress S&P500. Your VAR may not be dynamically stable as the IRF does not die out.
mr.rox
- 519
- 1
- 4
- 21