Question 1
The video actually explains this, but the explanation involves a lot of hand-waving.
Normalizing to mean 0 and variance 1 has the following effects:
All variables are measured on the same scale. This means that no one variable can "dominate" the optimization process. This is actually illustrated nicely at 0:47 in the video. When the scale of one input is large relative to another, the gradient with respect to that input will also tend to be larger than the gradient with respect to the other. This will lead to relatively large updates in the weights, causing the objective function to "bouce around" instead of converging gradually; it has the same effect as setting the learning rate too high.
It will help prevent the weights or the objective function from taking on values that are extremely large or extremely small. When a typical computer does arithmetic, it is much more likely to make mistakes or cause errors on extremely large or small numbers. Extreme values can also lead to numerical instability, where the answers diverge wildly given only small perturbations in the inputs.
Question 2
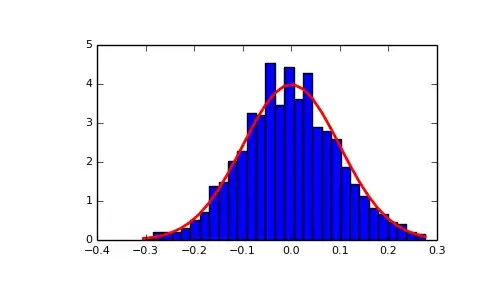
"Initialized using the normal distribution" means that a random value from the normal distribution is drawn for each weight.
Question 3
No. The y-axis represents "probability density," which is not the same thing as probability. It can only be interpreted as a relative value. It's not totally wrong (but also not totally right) to think of it this way: values close to a point with high probability density are proportionally more likely to occur than values close to a point with low probability density.
This is a subtle idea, and I have my own vivid memories of confusion around it. User "whuber" explains it better than I do in his answer to "Can a probability distribution value exceeding 1 be OK?".
Question 4
It's the size of the sample.
To read the help in the console, type:
import numpy.random
?numpy.random.normal
