2

I have a set of precise measurements, and what I want to do is count the frequency (how many time it appears) for each value.

The problem is that these are very precise measurements and with a naive method I would end up probably with every value at frequency one. So I need a method to cluster similar numbers and count them as the same values. The problem is that it should be done "dynamically", we can't just set some sort of interval for clusters because for example we would like to have these kind of result:

Data: 1, 2, 3, 4, 5, 6, 7, 8, 9   -> 1 and 2 are in different clusters
Data: 1, 2, 100, 200, 300, 400    -> 1 and 2 are in the same cluster

I have found some papers on computing similarities or some pattern recognition algorithm, but I really can't imagine how I should apply them. I am pretty convinced that from the set of initial data traditional statistics should be able to help us cluster these values. By the way I will eventually have to implement this in Python so no R (or other) magic please :) !
Nick Cox
  • 48,377
  • 8
  • 110
  • 156
  • Usually you define "bins" (intervals) by wich to group. One possible way to create these bins is to give the number of bins, $k$ and divide the observation range into $k$ equally large intervals covering the entire range (min to max), but most of the time knowledge about the measurement may suggest a better approach for chosing the bins. – AlexR Mar 12 '16 at 13:43
  • This thread may help: http://stats.stackexchange.com/questions/67571/how-can-i-group-numerical-data-into-naturally-forming-brackets-e-g-income – Nick Cox Mar 12 '16 at 14:08

2 Answers2

1

One possible solution will be to use a clustering algorithm; I'll suggest hierarchical clustering.

To implement hierarchical clustering, you need to specify both a notion of distance between points, and distance between clusters. If I understand correctly, you have measurements of several quantities with some error. It seems natural to me to define the distance between points (i.e. single measurements) as the absolute value of the difference between them, and between clusters A and B as the greatest distance obtained by selecting one point from cluster A and one from cluster B. This is known as "complete linkage".

The algorithm starts by considering the distances between all the points, and groups the closest two points, forming a cluster. It then considers the distances between all points and clusters, again, merging the closest two points/clusters into a single cluster. This is repeated until everything is in one cluster.

The nice thing about hierarchical clustering is that by examining the distances between clustered points (especially towards the end of the algorithm), you can sometimes get a somewhat natural number of clusters to try splitting the data into. This is often represented by a dendrogram. If the distances between clusters start getting quite large (relative to before) at some point in the algorithm, it might suggest that you're forcing clusters together which would be more naturally left apart.

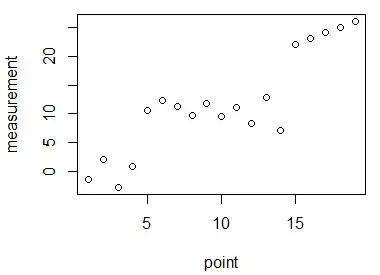
For example, suppose we have the following real numbers, corresponding to measurements (the ordering of the points doesn't matter):

enter image description here

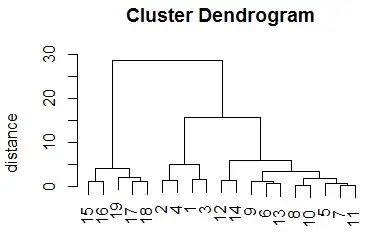
In the dendrogram below, the size of the vertical line where points/clusters are merged indicates the distance between the points/clusters at the time of merging. A natural number of clusters appears to be three (points 15-19 in one, 1-4 in another and 5-14 in the third) as the distance between merged clusters suddenly gets much larger at this point. That's not to say three is necessarily the "correct" number of clusters; only that it might be a reasonable thing to consider.

Dendrogram: visual representation of distances between merged clusters

hodgenovice
  • 288
  • 2
  • 8
0

I don't think you want clustering here.

Instead, why don't you consider adaptive thresholds.

Some examples:

  1. if the difference of teo values is less than 1/100 (or 1/10) of the standard deviation, consider them to be the same.
  2. Sort the data, and compute the average gap width (or better: median). Points with a difference of less than 1/100 (or 1/10) of this average gap are the same.

These are very simple rules, but they adapt to your data distribution. In your first example, the average gap is 1, in the second it is about 80.

Has QUIT--Anony-Mousse
  • 39,639
  • 7
  • 61
  • 96