7

Why we need the SD line(magenta) and how does it help us, besides just passing through all standard units of x and standard units of y pair points on the xy plot?

The SD line goes through the point of averages, and has slope equal to SDY/SDX if the correlation coefficient r is greater than or equal to zero. The SD line has slope −SDY/SDX if r is negative.

http://www.stat.berkeley.edu/~stark/SticiGui/Text/regression.htm
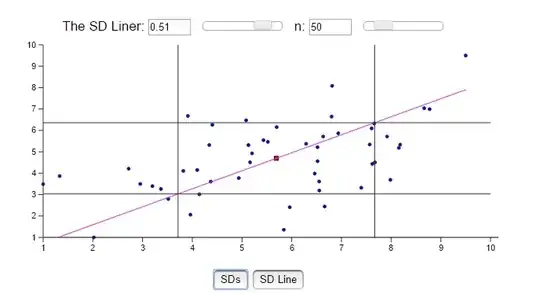
enter image description here

Oleg
  • 454
  • 5
  • 13
  • 6
    Please explain the context of your question and tell us what the "SD line" is. Although many people could make reasonable guesses, this is not a sufficiently standard term to be readily understood. And what, exactly, would a "standard deviation point" be? – whuber Mar 11 '16 at 22:11
  • @whuber I edited it, is it clear now ? thanks – Oleg Mar 11 '16 at 22:18
  • Although the answer at http://stats.stackexchange.com/a/2700 does not say so, the gray line shown in its third (last) figure is the same as your "SD line." – whuber Mar 11 '16 at 22:30
  • @whuber I don't understand why you write "your SD line" in quotes, it's not mine nor did I invent it, the word "SD Line" is mentioned in "Statistics 4th Edition by Freedman,Pisani and Purves" – Oleg Mar 11 '16 at 22:34
  • This question is not clear !! please provide some information on what an SD Line is – Wis Mar 11 '16 at 23:35
  • @raK1 I updated the question , also added where I found this SD Line (Berkeley course of statistics) – Oleg Mar 12 '16 at 06:27
  • @Oleg - The magenta line is not the standard deviation line. It is the linear regression line. The grey lines are the standard deviation lines. In which case they represent the mean + STD and the mean - STD. – Dunk May 31 '16 at 22:22

0 Answers0