1

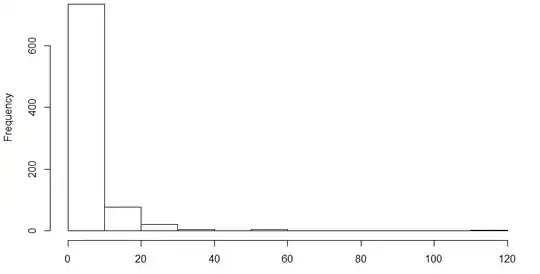
I want to run a simple regression predicting score on some task, from number of minutes spent doing another activity. My N is ~800. The score variable is normally distributed and measured in percentages, but the minutes spent variable is highly positively skewed (and measured in minutes), to the point where it may be considered discrete. The histogram of that variable looks like this:

enter image description here

Ultimately, I want to be able to interpret the regression coefficient associated with minutes spent. What is the most ideal approach to building a model that can ensure my Type 1 error rates are under control?

  1. Would bootstrapping the variable fix this issue given most of the values hover around 0?
  2. Would a more suitable option be to log transform minutes spent and running a t test on the coefficient like normal? How does one then interpret the coefficient?
  3. Does my predictor variable (score) being a percentage change the model I should use?

I see a similar thread here: Should I use t-test on highly skewed and discrete data?, but I guess I'm specifically wondering about the viability of bootstrapping vs. log transformations for this problem
Simon
  • 1,741
  • 3
  • 26
  • 38
  • Could you explain the sense in which "bootstrapping" would serve to build and fit a regression model? This may be a red herring, because the fundamental issue seems to concern what model would be appropriate for these data. Only after deciding that would questions of bootstrapping (for bias correction or constructing confidence intervals) be worth contemplating. But the choice of model is usually not determined by the distribution of your regressor (minutes spent); it needs to reflect how the scores vary with the minutes spent. – whuber Mar 04 '16 at 21:49
  • My research question is interest is what is the magnitude and direction of the relationship between score and minutes (i.e. if more minutes are spent, does score also increase?). So in my mind, fitting OLS regression would allow me to determine the linear relationship that exists. However, I was always taught that normality is a prereq for OLS regression hence my question about log transform (which would make my variable normally distributed), or to resample (I was also taught that, rightly or wrongly, resampling helps to fix problems of non-normality). – Simon Mar 04 '16 at 22:05
  • 1
    You don't need normality for OLS. In your case the issue might be non-linearity. If you have very skewed distribution it could be a sign of some kind on non-linear relationship. The log transform is used to linearise exponential relationships, e.g. your process is $y=e^{\alpha t}$. In this case OLS of the form $y=a+b x$ may not work, but OLS of this form will work: $\ln y = a + b x$ – Aksakal Mar 04 '16 at 22:25
  • This brings up a number of questions: What would be the reason for taking log(score) and not log(mins), as in, why transform the criterion? I've tried plotting score vs log(mins), and that gives me a nice linear relationship, though heteroscedasticity seems to be violated because most of the scores are around 0 (fix with wild resampling?). So I do get a linear relationship with a log transform of the predictor. – Simon Mar 04 '16 at 22:44
  • Given there is now a linear relationship after taking the ln of mins, should I actually be running polynomial regression instead of OLS, and not transform the data? – Simon Mar 04 '16 at 22:45
  • Finally, if OLS doesn't require normality, couldn't I just run OLS without doing any transformations? What would be the downsides to that? – Simon Mar 04 '16 at 22:45

0 Answers0