2

I'm trying to learn statistics on my own and currently taking an online class through edX. Unfortunately some things are not clearly explained. The online book used for this class contains the following problem and explanation

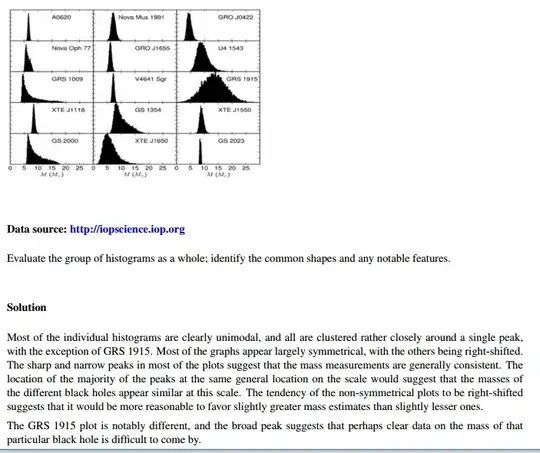
enter image description here

I'm not clear about the following statement:

The tendency of the non-symmetrical plots to be right-shifted (If the right side of the data is spread out across a wider area then this type of distribution is referred to as skewed right) suggests that it would be more reasonable to favor slightly greater mass estimates than slightly lesser ones.

I can't understand why we would want to favor slightly greater mass? We have less measurements that tell us that mass is large. Since most of the measurements are concentrated around one value, why can't I say that this value is my most likely mass.

Any help is appreciated.
flashburn
  • 241
  • 1
  • 3
  • 8
  • Related: http://stats.stackexchange.com/a/89383/11668 – rightskewed Feb 25 '16 at 05:51
  • @rightskewed Does related mean I should use this as an answer? – flashburn Feb 25 '16 at 06:00
  • 1
    I would disagree with most of this "solution," primarily because it is so vague and non-quantitative as to be almost useless. What exactly do "clustered rather closely," "largely symmetrical," "sharp and narrow," "same general location," "appear similar," "slightly greater," "notably different," "broad," and "clear data" really mean? If you were to cover the graphics with your hand and try to reconstruct them from these descriptions alone, it would be impossible. – whuber Feb 25 '16 at 14:55
  • 1
    If you are wondering what *is* possible, consider a statement like "the 15 histograms, which depict values from 0 to 30, all have peaks located from 5 to 14 with half-widths between 1 and 10, approximately. Those with smaller spreads tend to be more symmetrical than the rest, which may exhibit marked right skewness (in three of them, the peak is near their minimum)." Perhaps you could go on in a similar vein, *attempting to provide* quantitative *descriptions of the characteristics you see.* – whuber Feb 25 '16 at 14:59
  • My question wasn't really about trying to provide quantitative description of the characteristics. I'm simply wondering what skewness mean for the mass of the black whole and why the author makes a conclusion that if the data is right skewed we need to favor slightly greater mass estimates than slightly lesser ones. – flashburn Feb 25 '16 at 15:36
  • I'm voting to close this question as off-topic because it is unanswerable without knowing what "favouring slightly greater mass" is supposed to mean. – mkt Sep 12 '19 at 15:13
  • I agree with @whuber. Right skewness is simply a definition. In my opinion there are other histograms that appear to be widely spread. Of course they are all unimodal. You have a right to be confused. The question is answerable. The description of the histograms has terms that are not well-defined. That is your answer. Bill Huber gave you that answer in more detail in his first comment. his second comment was not meant as an answer but was just given to demonstrate how the histograms could be properly described. – Michael R. Chernick Sep 12 '19 at 15:57

0 Answers0