Drawing pictures helps.
The idea is to represent any finite probability distribution $\mathcal P$ over a sample space $\Omega$ of size $n$ as a mixture of $n-1$ distributions, each supported on at most two elements of that sample space. That probability distribution can be represented as a function
$$\eqalign{
&p:\Omega\to[0,1] \\
&p(\omega) := \Pr(\{\omega\})
}$$
whose value at any element $\omega\in\Omega$ is the probability of the singleton $\{\omega\}.$ By indexing the elements of $\Omega$ with $1,2,\ldots,n,$ you can plot such functions as bar charts, as in this example with $n=5$:
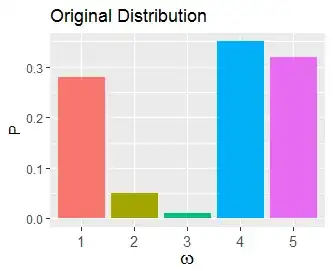
The objective is to express this bar chart as a stack of $n-1$ bar charts where (a) each component chart contributes $1/(n-1)$ of the total amount and (b) has at most two nonzero bars. Here's one way to do that:
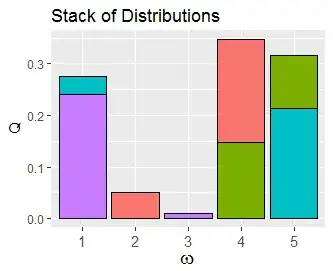
Each component is shown with a distinct color. The total height of each color is $1/(n-1)=1/4.$ No color appears in more than two horizontal locations.
The algorithm can be expressed recursively: find one component, peel it off the distribution (leaving a total probability of $(n-2)/(n-1)$), rescale what's left to make it into a distribution, and repeat until you're down to the case $n=2.$
The final figure shows the steps taken to find this mixture decomposition.
At each step, two "active" bars are identified: the highest bar with height less than $1/(n-1)$ and the highest bar among all the others. The first bar and a portion of the second one will make up the component identified at this step.
For example, at the first step there are two bars of height less than $1/(n-1)=0.25$ (at $\omega\in\{2,3\}$). The tallest of those is bar $2.$ Because its height of $0.05$ is less than $0.25,$ the remainder $0.25 - 0.05 = 0.20$ is trimmed off the top of the tallest bar (at $\omega=4$). The two quantities "peeled off" in this step are colored. They define a distribution on the set $\{2,4\}$ with probabilities $0.05/(0.25) = 0.2$ and $0.20/(0.25)=0.8.$ I presume this is what "$Q^{(1)}$" refers to in the question.
At step 2, bars $4$ and part of $5$ are chosen. At step 3, bars $5$ and part of 1 $1$ are chosen. Finally, at step 4 bars $1$ and all of $3$ are chosen. Since at each step $1/4$ of the total probability is removed, after step 4 nothing is left.
For the lemma, all you have to prove is that at each stage (a) two such bars exist and (b) the tallest bar is at least as high as the amount to be trimmed off its top. These are easily-demonstrated statements about numbers. (The proofs might be easiest by showing the contrapositive: if there's no bar lower than $1/(n-1),$ the total probability must be greater than $1;$ and if the tallest bar isn't tall enough, then the total probability must be less than $1.$)
The full result follows easily from the lemma by mathematical induction. I hope it's ok to leave it as an exercise, now that its essential simplicity has been revealed.
User @glen_b alludes to this method in his nicely illustrated answer at https://stats.stackexchange.com/a/68041/919, which inspired the graphics shown here.


