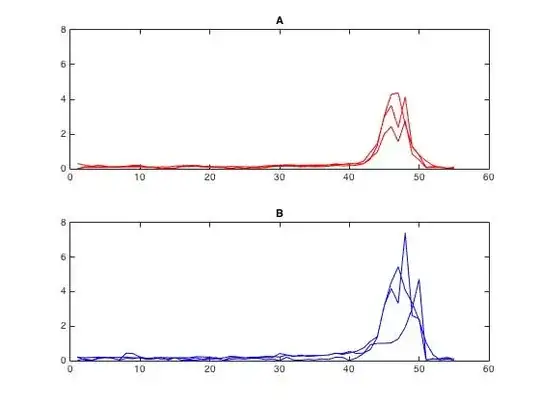
I'm looking to test for a difference between populations A and B. Each population is made of three time series which can be modeled well with a Gaussian or Gaussian mixture, and each have 55 data points. An example A and B are below, and in total I have a few thousand comparisons like this.
What's biologically relevant is the "intensity" of each curve. This can mean either the peak value, area under the curve, or something similar. My problem is that I have a small sample size (3 in each group). If sample size was larger I'd be happier to reduce each curve to a single number (e.g. maximum, area-under-the-curve, etc.) and then perform something equivalent to a t-test. However this throws out a lot of the limited information I have. It's also inappropriate to just take more data points from each curve, since points from a single curve are clearly not independent.
Is there a way to test for the difference in "intensity" between A and B (peak value, area under the curve, etc.) that preserves as much information as possible? Could I do something like take multiple points from each time series and perform a repeated-measures ANOVA, i.e. keep more data points and try to account for the non-independence?
