3

Suppose $y_{ijt}$ is the weight for subject $j$ of treatment $i$ at week $t$, then the model looks like this: $$y_{ijt} = \alpha_i + \beta_i t + \gamma_i t^2 + e_{ijt}$$ The codes look like this

proc mixed data=dat;
     class week trt subj;
     model bw10=trt trt*w trt*w2 / ddfm=kr residual;
     repeated week / subject=subj type=toeph;
run;

where "w" above is short for the continuous week variable. But the residual plots displayed below looks very weird as almost all the points are located above the zero line. When I change "type=toeph" to "type=arh(1)" or "type=un", similar phenomena happens. I guess it relates to the complex heterogeneous covariance structure, as it is normal in the homogeneous cases.
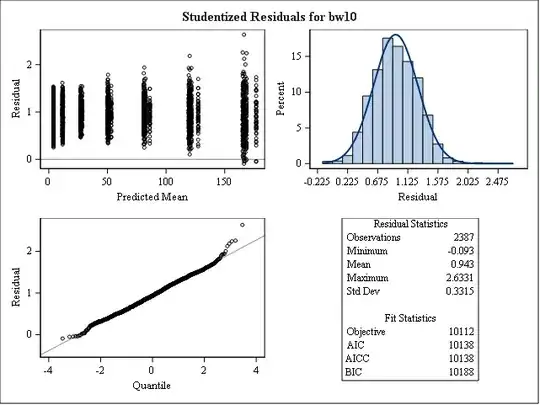
Residual Plots using MIXED

K. Huang
  • 31
  • 2
  • 1
    Not sure off the top of my head, but should week be defined as a `class` (categorical) variable? & if so, what does it mean for there to be a week squared term? – gung - Reinstate Monica Feb 18 '16 at 22:35
  • I second @gung's comment. This really seems like a contentious variable being binned. Also, I am not verse in SAS but is that a marginal or a conditional residuals plot? – usεr11852 Feb 20 '16 at 04:46

1 Answers1

1

Try adding w and w2 to your model statement:

model bw10 = trt w w2 trt*w trt*w2 / ddfm=kr residual;

or for those of us who prefer less typing:

model bw10 = trt|w|w / ddfm=kr residual;

If nothing else, the additions maintain the hierarchy restriction. The link below has exchanges related to model hierarchy that you might find interesting.

Do all interactions terms need their individual terms in regression model?

Edit: I just ran a small test, and adding w and w2 is not the solution to your problem. Should have done that first :) Hierarchy is probably still a good idea. You could also ponder a random coefficients model, but I doubt that would solve your problem. I suspect there could be something lurking that might be resolved only if we had access to the data.

user20489
  • 51
  • 4