9

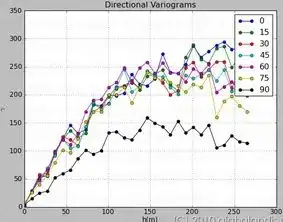
It is a straightforward approach having a set of coordinates (e.g., in 2D as {x,y}) and at least an associated variable (e.g., v) to calculate a variogram as a descriptor of the spatial dependency of the variable v through the field being studied.

enter image description here enter image description here

The question appeared to me is:
how to generate a realization of a dataset having a variogram? (inverse move!)
That is, there is at least one variogram available but neither dataset nor other description is available and the goal is to generate a realization of original (unknown) dataset that could have such a variogram.
What is the probability of having such a realization?

Updates / Comments: From variogram in the above context I mean empirical variogram. I suppose that fitting a variogram model is not an issue at least for this question. Also variogram is available as pairs (h, gamma).

Developer
  • 1,256
  • 2
  • 12
  • 23

1 Answers1

8

You can use sequential simulation to generate realizations of a random field that has the covariance structure given in the variogram model. In R this can be done using gstat. See demo(ugsim) and demo(uisim) from R code examples from gstat.

Etienne Racine
  • 211
  • 2
  • 8
Paul Hiemstra
  • 470
  • 3
  • 15
  • 1
    +1 First, of course, you have to fit a variogram model to the empirical variogram shown. Note that `geoR` easily performs simulations too. – whuber Nov 30 '11 at 15:50
  • But I assume that the OP has a variogram already. Or else this would be a chicken and egg problem :). – Paul Hiemstra Nov 30 '11 at 16:07
  • The graphic in the question, Paul, shows an empirical variogram, not a variogram model. You cannot use an empirical variogram directly to drive a stochastic simulation (it wouldn't be positive definite, so the simulation would likely run into numerical problems). But there's no chicken/egg problem: one fits the variogram model to this empirical variogram and then proceeds. Some information is lost--a good variographic analysis considers much more than a single empirical variogram *in vacuo* --but that can't be helped here. – whuber Nov 30 '11 at 16:19
  • By chicken and egg I mean that without data to fit the variogram model, there is no variogram model to generate new data. And by variogram, I mean variogram model. – Paul Hiemstra Nov 30 '11 at 16:22
  • I think we are circling around two interpretations of the question, which unfortunately makes no distinction between *model* variogram and *empirical* variogram. Although it illustrates an empirical variogram (and so that's how I understand every occurrence of "variogram" in the question), it very well could be referring to a model variogram, in which case you are perfectly right. – whuber Nov 30 '11 at 16:26
  • That happens all the time, also in journal papers :). From an empirical variogram it would be impossible to generate a new dataset, I think. – Paul Hiemstra Nov 30 '11 at 16:30
  • Actually, an empirical variogram is just fine: fit a model to it and proceed. I admit it is not easy to do the fitting when presented with just a graphic (but it can be done!), but if the actual values behind the right-hand graphic in the question were available, the process would be straightforward. – whuber Nov 30 '11 at 16:32
  • 2
    Part of my PhD was spent on automatic variogram fitting, so I think it is possible ;) – Paul Hiemstra Nov 30 '11 at 16:38
  • @whuber and Paul: Thanks you both. A very good discussion. I made it clear so as updates in the question. – Developer Dec 01 '11 at 00:19