3

I have a third party random number generator with a period approximately greater than $63*(2^{63} - 1)$ which generates numbers in the range $[0,2^{32}-1]$, ie $2^{32}$ different numbers. I've made some slight modifications and wish to verify its distribution remains uniform. I am using Pearson's chi-squared test for fit of a distribution, hopefully correctly, without knowing much about it:

  1. Divide $1000*2^{32}$ observations across $2^{32}$ different discrete cells (I figure the number of observations $n$ should be $5*2^{32} \lt n \lt 63*(2^{63} - 1)$, or, $5*\text{range} \lt n \lt \text{periodicity}$, using the five-or-more-rule, to gain decent confidence). The expected theoretical frequency $E_i = 1000*2^{32} / 2^{32} = 1000$.

  2. the reduction in degrees of freedom is 1.

  3. $x^2 = \sum_{i=0}^{2^{32}-1}(O_i - E_i)^2/E_i$.

  4. degrees of freedom = $2^{32} - 1$.

  5. lookup the p-value of a chi-squared ($x^2$) distribution given $2^{32} - 1$ degrees of freedom.

    As far as I can tell, no chi-squared distribution exists for that many degrees of freedom. What should I do?

  6. select a confidence significance value $c$ such that $p > c$ signifies the distribution is probably uniform. I have a large sample size but since I'm unsure of its relation to p-value (increased sampling reduces errors but significance value represents a ratio in the types of errors) I think I'll just stick with the standard value 0.05.

Edit: actual questions italicized above, and enumerated below:

  1. How to get a p-value?
  2. How to select a significance value?

Edit:

I've asked a follow-up question at chi-squared goodness-of-fit: effect size and power.
kjetil b halvorsen
  • 63,378
  • 26
  • 142
  • 467
user19087
  • 93
  • 1
  • 8
  • 1
    A chi-square distribution exists for any positive degrees of freedom. Do you mean "I can't find tables for really large d.f." or "some function I want to call won't take arguments that large" or something else? Note that failing to reject the null doesn't of itself imply that "the distribution is probably uniform" – Glen_b Dec 27 '15 at 06:29
  • I can't find tables for really large d.f. – user19087 Dec 27 '15 at 07:40
  • Isn't there little difference between the two? A p-value reflects how well the null fits, and though it doesn't imply another hypothesis won't fit better, its point is to highlight observations which probably don't fit the null (though not necessarily; could be an outlier). So conversely, for the sake of practicality I have to assume that all other observations (failing to reject the null) do imply "the distribution is probably (though not necessarily; could be an outlier) uniform". – user19087 Dec 27 '15 at 08:20
  • I'm just pointing out there is not a "maybe" middle ground in an either-or test, nor does either rejecting or failing to reject imply any hypothesis is true. And changing the confidence level just changes the ratio of false positives and false negatives. – user19087 Dec 27 '15 at 08:20
  • If the number of degrees of freedom is ''very large'' then $\chi^2$ can be approximated by a normal random variable. –  Dec 27 '15 at 08:38
  • Beware ... " p-value reflects how well the null fits" is not accurate -- a p-value is *not* a measure of effect size. – Glen_b Dec 27 '15 at 08:59

1 Answers1

7

A chi-square with large degrees of freedom $\nu$ is approximately normal with mean $\nu$ and variance $2\nu$.

In this case, ten billion degrees of freedom is plenty; unless you're interested in high accuracy at extreme p-values (very far from 0.05), the normal approximation of the chi-square will be fine.

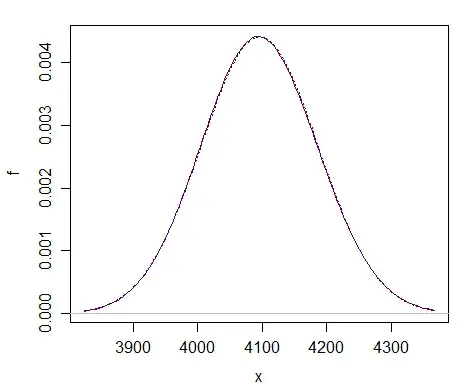
Here's a comparison at a mere $\nu=2^{12}$ -- you can see that the normal approximation (dotted blue curve) is almost indistinguishable from the chi-square (solid dark red curve).

enter image description here

The approximation is far better at much larger df.

Glen_b
  • 257,508
  • 32
  • 553
  • 939
  • 1
    That's a graph of $x^2$ and not $x$, right? And with such small p-values, what confidence level should I choose? – user19087 Dec 28 '15 at 18:32
  • The drawing is simply the density of a chi-square random variate ($X$), which density is a function of $x$. You're doing a hypothesis test, so you don't have a confidence level. You do have a significance level but you don't choose that *after* you see a p-value, you choose that before you start. – Glen_b Dec 28 '15 at 23:56
  • 1
    Yes, that is the graph of the PDF of the $x^2_k$ distribution. Given the name of Pearson's test statistic ($x^2$), I wasn't sure if $x$ references the x-axis (in which case I should take the square root of the statistic first) or the distribution name (in which case the statistic maps directly to the axis). Empirical testing of $\text{p-value} = 1 - CDF$ compared to tables confirms the latter. – user19087 Dec 30 '15 at 02:37
  • The p-value of $x^2_k$ is calculated via the CDF using: $1 - \frac{1}{\Gamma(\frac{k}{2})} * \gamma(\frac{k}{2}, \frac{x}{2})$, which involves computing [a power series](https://en.wikipedia.org/wiki/Incomplete_gamma_function#Holomorphic_extension) with extremely large numbers. – user19087 Dec 30 '15 at 02:38
  • At large k-values, the $x^2_k$ distributions approximates the normal distribution, so the CDF of the normal distribution is used: $1 - \frac{1}{2} \left[ 1 + \text{erf$\left( \frac{x - k}{2 * \sqrt{k}} \right) $} \right]$ as described by the answer ($\sigma$ and $\mu$ substituted as required). This involves computing [a power series](https://en.wikipedia.org/wiki/Error_function#Taylor_series) as well, though smaller numbers are involved and erf is a standard component of many standard libraries. – user19087 Dec 30 '15 at 02:45
  • It would be nice if the answer would incorporate the above three posts (excluding the duplicate, *which I have since deleted*). I assume you *did* intend for me to uses the CDF to calculate the p-value (if that's true, I don't see how using the normal distribution simplifies the answer much) ? Or did you intend a different approach? – user19087 Dec 30 '15 at 02:59
  • I know I should pick the significance level *before* I calculate the p-value, but I'm not sure how. – user19087 Dec 30 '15 at 02:59
  • I don't see how any of your comments is particularly relevant to the answer to the question that was asked. It seems to be heading off answering questions that were not asked (and I am curious -- what makes "erf(x)" more fundamental than $\Phi(x)$? -- just call the relevant function when you need it, it's mere implementation issue not really related to what was asked as far as I see). If you want to write an answer, you should certainly do so, but you'd need to explain how it related to the question actually asked. Perhaps you meant to ask something different from how I read it. – Glen_b Dec 30 '15 at 03:04
  • I asked how to get a p-value from $x^2$ if I couldn't look it up in a table - it seems I have to evaluate the CDF at a given point (substituting the normal CDF doesn't tell me how to get the p-value, or even simplify the procedure that much). As for how to select a significance level (which I confused with confidence level in the question), I'm still not sure how to do this? – user19087 Dec 30 '15 at 03:13
  • I assume $\Phi(...)$ describes the CDF of the normal distribution? Well, C99 defines $\text{erf($x$)}$ but not $\text{phi_normal_cdf($x, \mu, \sigma$)}$ (or equivalent). But anyway it is an implementation detail - I just used $erf(x)$ because how else would I write it down? I'm also not familiar with $\Phi(...)$ or other statistical notation. – user19087 Dec 30 '15 at 03:29
  • ... so responding using elementary functions is important. – user19087 Dec 30 '15 at 03:36
  • erf is not an elementary function; indeed it's explicitly listed [here](https://en.wikipedia.org/wiki/Elementary_function#Examples) as an example of a function that isn't. – Glen_b Dec 30 '15 at 06:57
  • Yeah but if its written as erf() instead of a recursive integral, you can pretend its elementary, equivalent to any f(x). All kidding aside, I'm still not sure I googled the right definition of $\Phi(...)$, so try to lay the high-level statistical notation on easy. – user19087 Dec 30 '15 at 07:54
  • $\Phi$ is simply the standard normal cdf. The cdf is much more common amongst statisticians than $\text{erf}$ or its equivalents for other distributions (erf you would tend to see from physicists or perhaps engineers). You can as easily treat $\Phi$ as elementary as you can erf -- *exactly* the same level of handwaving is required. – Glen_b Dec 30 '15 at 08:39
  • I've accepted this answer - almost everything I need to get me started is in the answer or the comments. I think I will need to ask another question to validate my overall solution, once I solve a few more stumbling blocks. – user19087 Dec 31 '15 at 21:14