Revised question:
My fundamental question seems to be: "I have data with error both in y and x. How do I estimate a value of true x so that y evaluated at that x will be distinguished from y(0) say, 19 times of 20?"
The data is from an actual measurement. The instrument I'm characterizing gives a response y relating to true x. My method of generating x includes uncertainties. When I make some conclusion of the instrument, I want to say how it performs in relation to actual x, not in relation to my measurement setup.
Original question:
I'm having data with error both in x and y. I made a Deming regression and found out the slope, intercept and their confidence bounds (and some other statistics I don't very well understand). The Deming script I used can be found here.
How do I draw confidence bands for the regression function?
Solution I found was to use MATLAB function predint, but that requires a cfit-object which I don't have. These are the approaches I've tried so far (and reasons why they didn't work):
1a) Make a cfit-object from the parameters I have. (Couldn't figure out what I was supposed to give the cfit-constructor.)
1b) Alter an existing cfit-object. (Altering parameter values zeroed error and couldn't find out how to set them.)
2) Generate a dataset with fit parameters and then use MATLAB fit-function to obtain a cfit object with my parameters. (Didn't yield expected results.)
3) Draw the bands from scratch. (Got swamped by statistics way over my head).
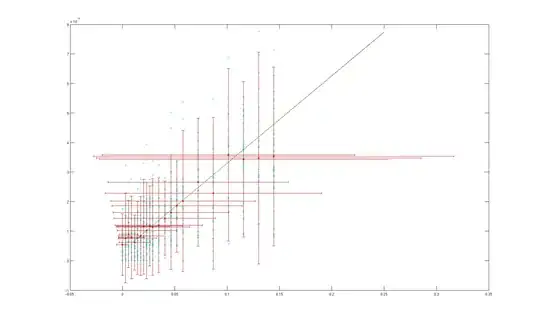
Here is an example of the plot. Cyan dots are the actual measurement points, red dots are their means for each x value. Vertical error bar represents 2$\sigma$ of the cyan points and horizontal bar represents calculated uncertainty in x measurements. Regression is made only on the linear section of data. On this section the ratio of y error and x error is between 0.7e-4 and 1.4e-4, which I thought was similar enough (same magnitude). Equation for the regression line is (3.0+-0.7)e-4*x + (3+-2)e-6.
Progress so far:
The thing I was trying to do, calculating CI bands based on the regression coefficients and their estimated errors seems to be impossible:
You can't calculate the bands using just the CIs of slope and intercept because the bands are generated by calculating the CIs at each x. Duncan, comment
Here is a example of how the variance of the predicted value $\hat{y}$ is calculated. The difference between $\alpha$ and $\hat{\alpha}$ is that $\alpha$ is the unknown true value and $\hat{\alpha}$ is the estimate got from the regression. Now, this equation requires both, so how it can be calculated if true coefficient is not known? Also what are E and D? If I can solve the variance as a function of x, I will get the standard deviation as its square root.
My measured x-values contain error, but I'm interested in question "what y can I expect from true x". Will this have an impact on my calculations? It also seems that I should be interested in prediction bands rather than confidence bands.
Please correct me if I had any misconceptions.
