4

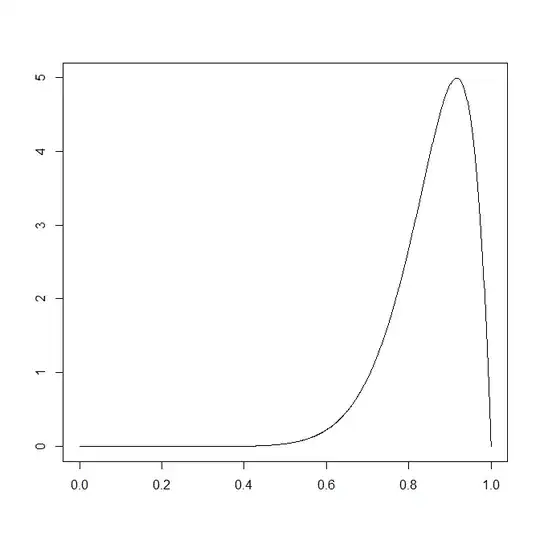
I just ran an experiment and I'm not sure how best to analyse the data. My data are distance values between objects in a metric space bounded by [0,1]. I have drawn up a probability density estimate as follows:enter image description here

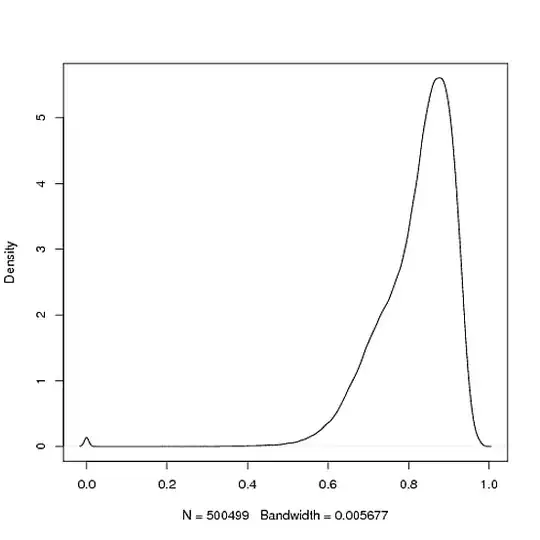
This looks to me like a kind of hybrid between an exponential and normal distribution, what tests can I run to make better sense of this?


More background:

This metric space is a finite corpus of Documents, the distance between which indicates their similarity: if the distance is 0 they are identical, if 1 they have no commonality. This sample represents all the distances between 1,000 randomly selected documents.

chl
  • 50,972
  • 18
  • 205
  • 364
Robert
  • 161
  • 4
  • Simply due to the boundedness of the metric, it clearly cannot be a hybrid of an exponential and a normal, both of which have unbounded support. Judging by your picture, such a mixture is not a viable candidate distribution, even as an approximation. You say that this is a metric space. Is it not Euclidean, then? What does $d(\cdot,\cdot)$ look like? – cardinal Nov 12 '11 at 18:03
  • Sorry, please do excuse my ignorance! No, it is not Euclidean, it is a metric over multisets based on Shannon entropy – Robert Nov 12 '11 at 18:09
  • No need at all to apologize! I was simply giving an initial off-the-cuff assessment. :) – cardinal Nov 12 '11 at 18:12
  • What does the underlying set of elements look like? Is it finite? (Neither of those questions may ultimately be relevant, I'm just trying to get a clearer picture of what you might be looking at. Feel free to edit your answer and add in more such details, if you'd like.) – cardinal Nov 12 '11 at 18:18
  • Hopefully this clears things up? – Robert Nov 12 '11 at 18:29

3 Answers3

2

I can't answer the question of what is the distribution of the distances, but I can shed some light on why you are seeing that very sharp narrow peak. This is an aspect of the dimensionality curse, known as distance concentration. To the best of my knowledge the first paper on this phenomenon was Beyer et al "When is nearest neighbor meaningful" where the authors demonstrate that in high dimensional probability spaces one can expect the distances between points to converge to a common value with high probability. The phenomenon is very general and holds for any metric (for example), although some converge slower than others. Some relevant links are in the post by @Denis (and my answer there).

Bob Durrant
  • 698
  • 5
  • 11
  • Thanks. Actually, I'm quite well aware of the curse of dimensionality - in fact I'm looking into the indexability of high dimensional data, hence why I'm interested in the distribution – Robert Nov 12 '11 at 21:54
  • Difficult to say anything more concrete without more details I think. I'll have to pass and let someone more knowledgeable try to help if, as I suspect, the metric you are using is the semimetric over tree equivalence classes described in http://www.sciencedirect.com/science/article/pii/S0306437910001353 adapted in some way to text data. – Bob Durrant Nov 14 '11 at 13:48
2

One simple way would be to model your data as beta distributed. The beta is by definition between 0 and 1:

xx <- seq(.01,.99,by=.01)
plot(xx,dbeta(xx,shape1=12,shape2=2),type="l",xlab="",ylab="")

beta density

For an added twist, you could model the little bump at zero by mixing the beta with a point mass there. This is commonly done to add "additional" zeros to the Poisson distribution ("zero-inflated Poisson"), but it looks like it could be helpful in your case, too.

Stephan Kolassa
  • 95,027
  • 13
  • 197
  • 357
1

A circular normal distribution is of course unbounded and so it would not be an example where all the distances would fall in a unit circle but if we make the variance small enough the tail outside the circle is small. The density for the distance of a point from the center of the circular normal distribution is called a Rayleigh distribution and it has the skewness behavior similar to your plot. Remember $D=\sqrt{X^2+Y^2}$. So the shape of the distribution is primarily dictated by the function of $X$ and $Y$ that it is. Note that if $X$ and $Y$ were independent standard normal distributions $D$ would be the square root of a $\chi^2$ with 2 degrees of freedom.

Macro
  • 40,561
  • 8
  • 143
  • 148
Michael R. Chernick
  • 39,640
  • 28
  • 74
  • 143