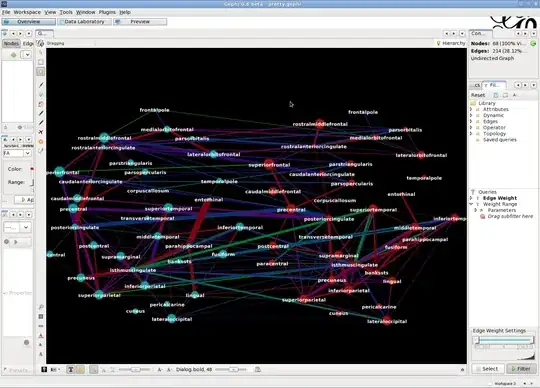
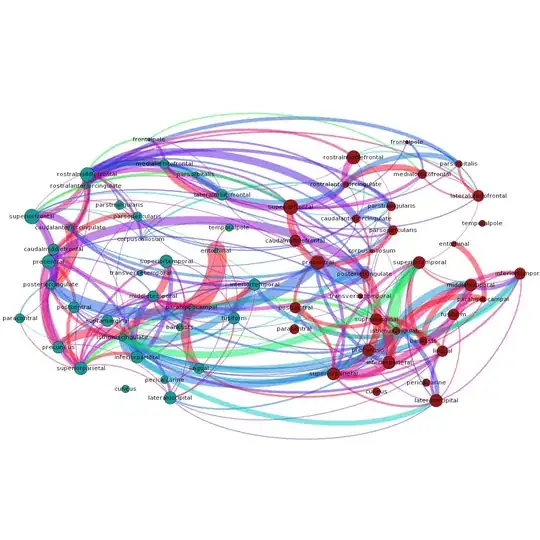
I have a variety of brain regions and information about how they're connected. (Not FMRI in this case, but the diffusion information about the white matter tracts connecting gray matter regions.)
I'd like to graph this information sensibly to deliver to the scientist who asked me for this information along with a spreadsheet describing each connection. I'd like to represent both the positions of the gray matter regions (I can project them onto the mid-sagittal plane to get 2D positions or do something similar) and the characteristics of the connections. (Probably just 2 or maybe 3, so I imagine color and thickness would cut it.)
I'm not very familiar with graph visualization tools -- I started with the graphviz dot format -- but now I'm reading about a multitude of tools. What sort of graph visualization tools ought I to use?

