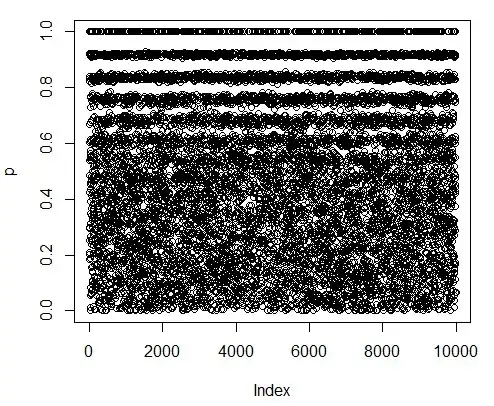
I generated p-values from 10K trials with null hypothesis set to true. My goal was to see what the distribution of random p-values is like. The sample size of each test was 2000 with a 5% success rate. p-values calculated using "N-1 two proportion test" based on normal distribution (Sauro 2012). Here's the formula:
Are there ranges of p-values that are unlikely, as this chart shows? Or is there some flaw in my method?
I do remember reading something about p-values below 0.05 being more likely than around 0.05, but I don't see that here. Instead I see this banding closer to the high p-values.
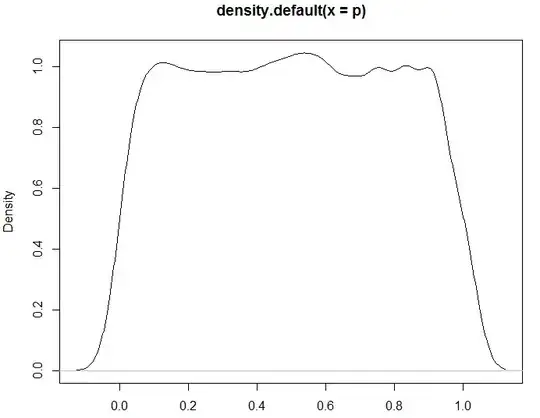
I also plotted the density of p-values. This has minor waviness at the high end of the chart, which I guess corresponds to the big bands. The density chart usually shows a slight peak at 0.1.
Can anyone confirm any of this and/or point me to some info on expected distribution of p-values?


