2

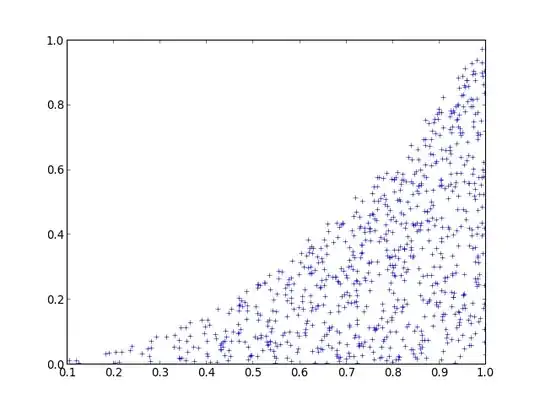
enter image description here

Looking at the graph, clearly there is a correlation between the $x$ and $y$ values. However, this correlation is not linear, hence it cannot be studied by the pearson correlation coefficient.

I know there is the Spearman rank correlation coefficient, however this coefficient studies whether $x$ increases whenever $y$ increases. But in my case, let's say for $y = 0$, $x$ is increasing. So again, this correlation cannot be studied by the spearman correlation coefficient. What is the best way to quantify this correlation?

Plus, I'd appreciate to ways to do it in python.
aloha
  • 410
  • 2
  • 9
  • There's a discussion in this thread of the many approaches to nonlinear dependence structures... http://stats.stackexchange.com/questions/179511/why-zero-correlation-does-not-necessarily-imply-independence/179551#179551 – Mike Hunter Nov 01 '15 at 17:00

1 Answers1

1

A good measure of dependence is the distance correlation coefficient. It allows to measure many kinds of relations. Thus you can try it on your data.

In R, there is a procedure named "dcor" within the package "energy" to compute this coefficient.

In Python, here is an implementation of this coefficient : https://gist.github.com/josef-pkt/2938402

Jacky1
  • 646
  • 3
  • 9