I would appreciate any suggestions of how to analyse the following dataset. It was suggested that I use ANOVA, but I wanted to check with the community.
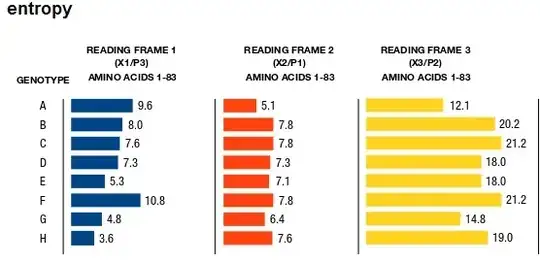
I have a protein where I have calculated the entropy of each reading frame (blue, red and yellow). In the attached figure, the bars are a sum of the values calculated. It would probably be better to represent the values as means rather than total sums. Anyway, eye-balling it, the yellow section has a higher entropy than the blue and red regions, whereas red and blue look similar. However, I need to add some statistical weight to this and I would only compare reading frames within one genotype. I'm unsure whether to use ANOVA (repeated as it's 3 groups ?), a pairwise.t.test in R, or even Friedman's test, it's been a while. Perhaps this question is similar to How to test hypothesis of no group differences? ?
I didn't find questions and answers that I identified with, so apologies if I missed one.