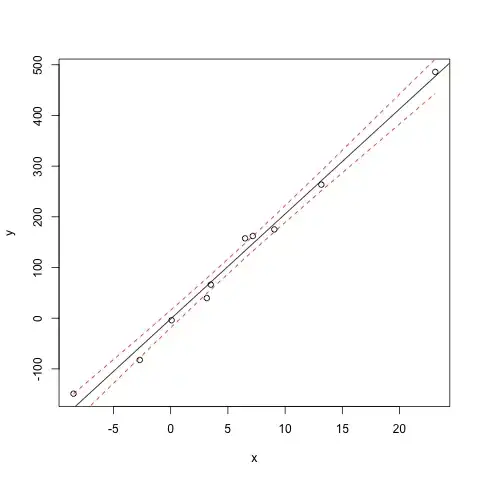
 I have a naive question about regression. How does R function predict.lm compute the 95% confidence interval of the fitted line? In particular why is this not a straight line?
 x <- rnorm(10,0,10)
 y <- 20*x + rnorm(10,0,2)
 fit <- lm(y ~ x)
 newx <- sort(x)
 prd <- predict(fit,newdata=data.frame(x=newx),interval = c("confidence"),level = 0.95,type="response")

 # plot
 plot(x,y)
 abline(fit)
 lines(newx,prd[,2],col="red",lty=2)
 lines(newx,prd[,3],col="red",lty=2)
Can somebody help me understand how the upper and lower bounds of 95% CI of the fitted line are computed by predict?