4

I have a set of final exam grades for an entire year of students, and I need to calculate quintiles from them. How should I go about it?

Also, is the range from the arithmetic average and the top of the set smaller than the range from the third quintile to the fifth quintile?

Glen_b
  • 257,508
  • 32
  • 553
  • 939
ppp
  • 143
  • 5
  • I'm not sure I understand the last paragraph. Do you mean the range of the scores within quantiles? – Patrick Coulombe Oct 25 '15 at 16:17
  • @PatrickCoulombe I mean that, if we put all our grades in a histogram, and we split that histogram in quintiles and in the rightmost-to-average and leftmost-to-average, will it always be that the the third, fourth and fifth quintile will have more members than the rightmost-to-average set? Sorry for my english (and for my almost ignorance of statistics in general). – ppp Oct 25 '15 at 16:30
  • 3
    1. Each quintile will have the same number of members (assuming the total population is a multiple of 5). 2. The arithmetic average could be in any quintile. Unless you have a known distribution and a large sample size, you cannot know in advance into which quintile the arithmetic mean will fall. For example, say you have a small class where most students did extremely well and one student scored a zero. It is quite possible that your average will fall in the bottom quintile. – C8H10N4O2 Oct 25 '15 at 20:09
  • @C8H10N4O2 what if it's more of a log-normal distribution? – ppp Oct 25 '15 at 20:17
  • 3
    Strictly the quintiles are values such that 20, 40, 60, 80% of values are smaller. It is common to extend the term to intervals those values define. Even if the number of values is a multiple of 5, you need a convention on how the quintiles are defined, for a group of 100, that might be use the average of the 20th and 21st smallest, etc. For sample size not a multiple of 5, you need a convention even more, and several have been suggested. Good statistical software will always have a dedicated command, function or routine but it might be under some name like quantile or percentile or centile. – Nick Cox Oct 25 '15 at 23:29
  • @PatoSáinz The quick solution is to rank your exam scores and group them into 5 buckets. If you've indicated how your final exam is graded, I missed it. Are they scaled from 0 to 100? Accounting for ties and bunching around a few values, I don't think it's likely that you will derive equally sized quintiles. For instance if you have a bunch of exams clustered around 84, 85 and 86, would you put them in separate buckets? Also, your question about the arithmetic mean is better answered by leveraging the median not the mean, since the median and the mean agree only if scores are bell-shaped – Mike Hunter Oct 26 '15 at 11:41
  • @PatoSáinz Also, good joke with your CV handle! – Mike Hunter Oct 26 '15 at 11:44
  • @DJohnson Good advice generally, but you're indulging the common confusion between quintiles and the intervals they define. Also, at this level "size" can be ambiguous, as between the frequency of values in an interval and its width. So, one ambiguity can feed another. – Nick Cox Oct 26 '15 at 11:45
  • @NickCox Interesting comment. Would you say more about the "common confusion?" – Mike Hunter Oct 26 '15 at 11:47
  • The point was made in my previous comment. The first quintile is defined by 20% of values being lower (lots of small print about the precise rules). Some then take the interval with that as upper limit as being also the first quintile. In some fields it is worse: people want to classify values in quintile bins or groups, which are then labelled by their upper limits, i.e. the individual values are thrown away in subsequent analysis. – Nick Cox Oct 26 '15 at 12:43
  • @NickCox There is no shortage of dumb stuff that people do with data, e.g. and to your point, throwing away individual values in favor of retaining quintile assignments. As analysts, there's only so much stat policing that can be indulged or, for that matter, that the "great unwashed" will sustain. My point was really about relaxing strictly assigned boundaries -- however defined with all the caveats and nuances noted in this thread -- that would put "bunched" scores (84s, 85s and 86s) together into separate quintiles. – Mike Hunter Oct 26 '15 at 18:27
  • 1
    @DJohnson I think we do agree. My own view is that if quantiles are also tied values (e.g. 42 is a quantile and there are several values of 42), then any quantile-based binning must assign all 42s to the same bin even if the price is now unequal numbers in bins that "should" have equal numbers. People using my favourite software are often puzzled by this and don't see that the alternative of assigning some 42s to one bin and the others to another is quite arbitrary, especially for comparing with other variables. – Nick Cox Oct 26 '15 at 18:33

1 Answers1

14

At heart you divide your sample into 5 pieces of as near to equal size as possible. This involves finding four places to divide them (cutting a sausage in two pieces requires one cut, cutting it in five requires four cuts); these cutting positions are the quintiles.

If your sample size is one more than a multiple of 5, several common formulas for sample quintiles put the respective quintile at the observation which splits the counts of the remaining values in the ratios 1:4,2:3,3:2 and 4:1 (e.g. if you had n=21 those particular formulas will put the quintiles at the 5th, 9th, 13th and 17th sorted values).

If you're not interested in the values taken by the quintiles so much as the values in the 5 bins they create, I'd suggest you try as far as possible to place boundaries in between data values (rather than at data values).

However, there's a variety of other rules which would do slightly different things.

The package R, for example, offers no less than nine rules for quantiles; some will agree with others at particular $n$ and disagree at other values of $n$.

Here's the result of applying the nine rules to quintiles on the values 1,2,...,21:

Method    20%   40%    60%    80% 
  1        5     9     13     17 
  2        5     9     13     17 
  3        4     8     13     17 
  4       4.2   8.4   12.6   16.8 
  5       4.7   8.9   13.1   17.3 
  6       4.4   8.8   13.2   17.6 
  7        5     9     13     17 
  8      4.600  8.867 13.133 17.400 
  9      4.625  8.875 13.125 17.375 

Where the number is an integer, that indicates that a particular observation (of the sorted values) is used as the quintile for n=21. When it's not an integer, a weighted average is used (e.g. under method 8, the first quintile is 0.4 x the fourth-largest and 0.6 x the fifth-largest).

The details of the nine* methods are given in Hyndman, R. J. and Fan, Y. (1996) "Sample quantiles in statistical packages," American Statistician 50, 361–365, and also on the R help page on the quantile function (alternative location here).

At n=19, n=20 and n=22 the picture is different again. Here's a visual display of the variation in values for the different definitions at n=20 and 21:

enter image description here

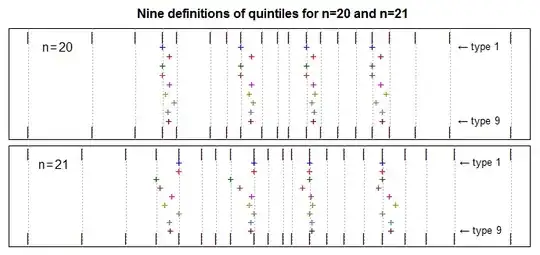
As you see, the question is not simple! It really depends on which definition you want. Personally I lean toward types 2 and 7 (I tend to use something close to 2 if working by hand, and just take the default 7 when using R; the two are pretty similar).

is the range from the arithmetic average and the top of the set smaller than the range from the third quintile to the fifth quintile?

There are only four quintiles, the 20th, 40th, 60th and 80th percentiles. You need to clarify your intent there. By "fifth quintile" do you intend the largest value in the sample?

However, I will say that in general there's no set relationship between $\max-\text{mean}$ and some particular inter-quintile range; the relative sizes depend on the shape of the distribution.

It's quite possible for the mean to lie above the fourth quintile or below the first quintile. The maximum must of course lie above (or equal to) the fourth quintile.

An example of a set of numbers where the mean lies above the fourth quintile:

 (1, 1.5, 2, 2.5, 3, 3.5, 4, 4.5, 5, 100)

(that works for any of the nine definitions we've looked at examples of).

To get a set of numbers where the mean is below the first quintile, subtract these numbers from 101.

will it always be that the the third, fourth and fifth quintile will have more members than the rightmost-to-average set

This attempt to clarify doesn't seem to make it much clearer; this again suggests the existence of a fifth quintile when there are only four - again, do you perhaps mean the maximum?

Between each pair of adjacent quintiles you should have (almost exactly) 20% of the data. The minimum to mean or mean to maximum could contain more than 80% of the values or less than 20% of the values.

However, it may be possible to derive a bound in the relationship between max-mean and some interquintile range; I don't recall having seen one but it would be interesting to explore.

Glen_b
  • 257,508
  • 32
  • 553
  • 939
  • 4
    Excellent advice as always. I would add two simple rules for yourself. Always plotting data will show where strange features of your data, such as ties or gaps, are causing puzzling results (which then turn out not to be puzzling; two or more quintiles may even be equal in the case of ties). These differences of rules bite most for (very) small samples, where quintiles may be too sensitive to minor details in the data to be especially useful any way. – Nick Cox Oct 26 '15 at 11:34