3

I am trying to find a predictive model for my dataset with the following properties: I have 52 predictors, 1 response and 53 records. The predictors differ in scaling and type: 7 of them are categorical variables and the rest is numeric (with discrete and continuous values with different range).

My first Idea was to use a Random Forest because it can handle both with categorical and continuous data and is useful for datasets with more variables than records.

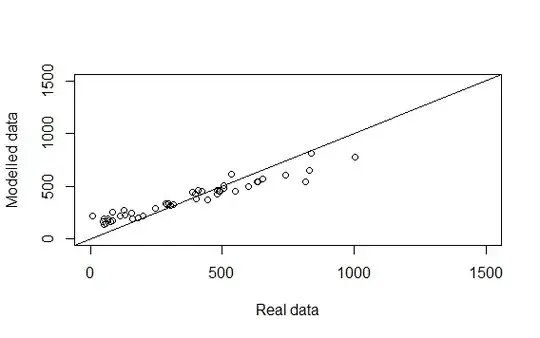
The result of the fit of the learning data is a 0.85 R^2. But consider the plot of the response variable against the modelled data:

enter image description here

I think the model overrates the little values of the response and overrates the bigger ones.

My questions:

1) How should I deal with this under-/overrating? What could be the reason for this and how could I improve the result?

2) Which other models can I use (I don't know much models which can deal with the described properties of my data)?

amoeba
  • 93,463
  • 28
  • 275
  • 317
R_FF92
  • 251
  • 2
  • 9
  • 1
    This is a common problem of random forests. It often happens that random forests have problems predicting the tails of the outcome's distribution. I've read that one way to improve upon this is to perform a linear regression on each node instead of averaging, though I wasn't able to find any implementation. I don't recall where I read this. If I find the source I will post it here. – George Oct 07 '15 at 12:30
  • Actually that RF predictions "flattens out" / "gets a smaller slope", when the model regression is not perfect, is a very sensible 'Baysian-kinda' property. Think of your mean response as your prior. The RF model will effectively incorporate the uncertainty in its predictions, such that these will move closer to the mean response. The same is true for classification. Only when the regressor or classifier is performing 100%, will the predictions not be effected by the prior. – Soren Havelund Welling Oct 07 '15 at 14:01
  • I agree with George and DJohnson also. You may be able to tune your model with variable filtering, I would personally favor highest absolute spearman correlation or variable importance. You need to wrap the entire process in a e.g. 10-fold cross validation to assess over fitting. – Soren Havelund Welling Oct 07 '15 at 14:07
  • Can I also use the OOB estimates for variable importance to reduce dimension? – R_FF92 Oct 08 '15 at 08:11

1 Answers1

1

There are several components to your question. These include (but are not limited to): 1) constrained variable selection when the number of observations (n) is small relative to the number of predictors (p), 2) heuristic selection vs optimization, 3) dealing with mixtures of distributions among the predictors, 4) comparison of the fit between predicted and actual, 5) finding an appropriate model for y, and 6) separating statistical understanding from pure, machine learning prediction.

I'm not an advocate of optimizing approaches to variable selection as wasteful of CPU. Moreover, given the smallish n and p which is not so big anyway, I think leveraging an RF would be methodological overkill. A more useful model-building step (assuming some exploratory work has been done to assess whether or not applying transformations improves the fit) would be heuristic evaluation of pair-wise relationships between y and the candidate predictors. The idea here is that if a potential predictor does not have at least a modestly significant relationship with y, then it probably can be eliminated. This could be done in an ANOVA-type context using a relaxed significance of p<=.15 or so for inclusion. Of course, causal purists would argue that tertiary (masking) and/or interaction effects can be lost this way but, in practice, these tertiary effects are usually small if they are significant at all. Besides, a better guide to including tertiary effects is prior theoretical insight. The advantage of using ANOVA is that it is invariant to the scale (mixture) of distributions, providing a measure (the F-statistic) of relative effect sizes leading to an preliminary importance ranking in selecting predictors. Of course, ANOVAs use linear assumptions. If you think the relationships are nonlinear then there are many tools now for evaluating nonlinear dependence but these require a level of sophistication that your question belies.

The under/over weighting you point out in the scatterplot is a bit of a red herring since it's benchmarked against an orthogonal, 45-degree line. The better comparison would be to an average line of best fit, which would be demonstrably balanced.

In terms of appropriate models for your data, I don't see any reason why classic OLS estimation wouldn't provide reasonable insight. Of course, there are other methods such as partial least squares which are designed specifically for situations where p>>n but your mixture of distributions precludes their use.

You haven't indicated what your "high-level" goal is. Are you simply trying to find a good, predictive fit or are you trying to uncover some underlying process in order to gain insight into causality? Either way, by choosing predictors that maximize the predictive fit, you have put a stake in the ground in terms of understanding causality.

Final model variable selection would be based on those variables that passed the threshold of relaxed significance and could be identified using the lasso, a widely available variable selection method.
Mike Hunter
  • 9,682
  • 2
  • 20
  • 43
  • 1
    Why is comparing $y$ and $\hat y$ against diagonal line is a "red herring" is not clear to me. – amoeba Oct 07 '15 at 12:22
  • I merely suggested that it was a "bit" of a red herring, particularly when compared with the actual line of best fit. – Mike Hunter Oct 07 '15 at 12:29
  • 4
    I just don't understand the logic here. If $\hat y$ is always $y/2-1000$, then a linear fit would be perfect with R^2=1, but obviously prediction in this situation is strongly biased. I don't see how "best fit" is relevant at all. – amoeba Oct 07 '15 at 12:30
  • Are you questioning whether or not the line of best fit in this case would not be "balanced" wrt under-/over-fitting? – Mike Hunter Oct 07 '15 at 12:39
  • 1
    Of course not, "best fit" is always "balanced". I am saying that this is irrelevant for this discussion. – amoeba Oct 07 '15 at 12:40
  • Please elaborate on why it's irrelevant. – Mike Hunter Oct 07 '15 at 12:41
  • Thanks for your anwser DJohnson, it really helps me because I have not that experience in predictive modelling. – R_FF92 Oct 07 '15 at 13:06
  • @fabian92...Great! Being new to CV, I could really use some points or a vote! – Mike Hunter Oct 07 '15 at 13:17
  • @George, to your point about the bias in RFs, here's a link to a several year-old CV discussion of that issue... http://stats.stackexchange.com/questions/20416/how-should-decision-tree-splits-be-implemented-when-predicting-continuous-variab/20521#comment37572_20521 – Mike Hunter Oct 07 '15 at 13:21
  • @DJohnson: I have a few more remarks and questions. First I answer your question about the 'high-level' goal: The most important goal is to predict data which are not used to fit the model. But it is also important to understand causality because the model is used for engineering purpose! Therefore, the random Forest is not the best because it is not easy to interpret. I would like to try OLS but have a few questions: – R_FF92 Oct 07 '15 at 13:34
  • 1) Can OLS deal with dependence between the predictors? 2) Is a scaling of the predictors neccessary? 3) How to deal with the categorical variables? 4)General question: How do I measure the predictive fit (via Cross validation?) and what are measures you would look at when you decide which model you chose for prediction (does it make sense to consider R^2 of the fitted data and the graph like I plotted above ?) – R_FF92 Oct 07 '15 at 13:35
  • Good questions for which answers are a bit more involved than this little comment arena allows. I suggest that we take this into "chat." Of course, doing that would make it more cumbersome to get wider feedback on any suggestions made, but that's up to you. – Mike Hunter Oct 07 '15 at 13:42
  • Yes of course thats a good idea – R_FF92 Oct 07 '15 at 13:51
  • How do we initiate a "chat?" I do know that if we keep commenting back and forth, "chat" will automatically appear as an option... – Mike Hunter Oct 07 '15 at 14:18
  • It is my first day here... I dont know how to start the chat here – R_FF92 Oct 07 '15 at 14:21
  • Unfortunately, I have no time left to discuss today. It would be great to go on tomorrow with a chat (Perhaps you find out how it works)!! – R_FF92 Oct 07 '15 at 14:27
  • Oh I see that I have not enough reputation to start a chat... – R_FF92 Oct 08 '15 at 07:15
  • I'm new too. I did notice that if we just comment back and forth enough, the "chat" option automatically pops up...regardless of your reputation. – Mike Hunter Oct 08 '15 at 09:19
  • Yes. But when you click on the bottum 'move discussion to chat', I cant go on because I have not enough reputation. I think rep 20 is neccessary perhaps I will reach this today :) – R_FF92 Oct 08 '15 at 11:08
  • Let us [continue this discussion in chat](http://chat.stackexchange.com/rooms/30014/discussion-between-fabian92-and-djohnson). – R_FF92 Oct 08 '15 at 11:10
  • @DJohnson: You have time for a short Chat today? – R_FF92 Oct 09 '15 at 10:41
  • now works for me...later could be problematic... – Mike Hunter Oct 09 '15 at 10:55
  • ok would be great – R_FF92 Oct 09 '15 at 11:08