I have been using Lifelines library for survival analysis.
I observed a difference in the plots using the Kaplan Meieir Fitter estimator on my data.
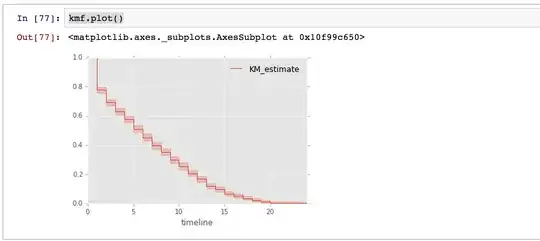
The above plot of the data, provides a step function using the KMF estimator.
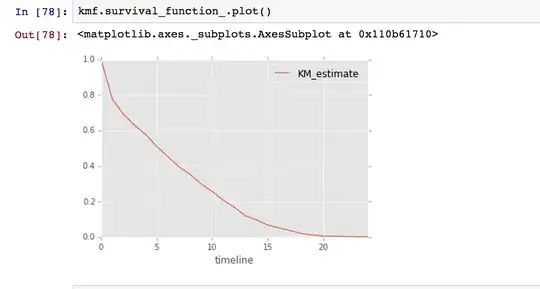
While calling kmf.survival_function_.plot(), it provides the following plot:

I was of the impression that both the plots should produce the same results. If not, is there a difference between the survival function and the KMF estimator?
Why does one plot produces a straight curve while the other produces a step function?
I quote from the Lifelines docs: "Alternatively, we can call plot on the KaplanMeierFitter itself to plot both the KM estimate and its confidence intervals:"
Doesn't this mean both the plots should be the same? Can someone point out what I am missing here?
