Given the following chart of data:
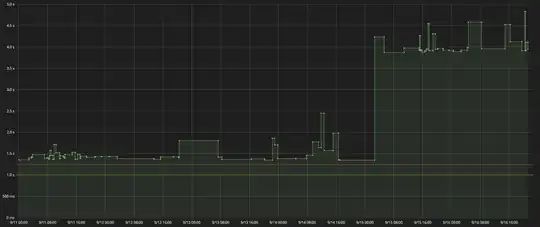
which represents duration metrics gathered at absolute times, I am trying to determine when/if any of the values exhibit a jump in durations. In the example chart, the trend of data appears to hover around the 1.4 second mark, while later in the chart, at a particular moment, the data hovers under 4 seconds.
Given a collection of data points similar to the one that produced this chart, is there a statistical function that can find the significant breakpoints in the data? I am a statistics n00b, but doing some research has led me into piecewise regression, but I do not understand it well enough to determine if it is the appropriate route.
For what it's worth, I'll be performing the analysis in JavaScript, so external libraries that have said function probably won't be of much use. I'm more looking for the actual math to arrive at the conclusion so that I may translate that into JavaScript.
Thanks for the advice.