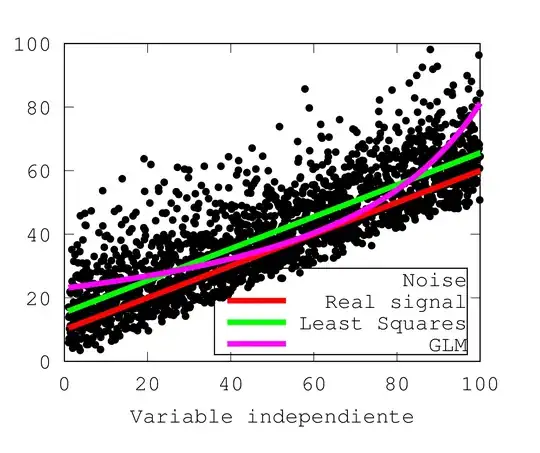
To illustrate the usefulness of GLMs in comparison to the least square method I did a simple program in which I add random noise to a straight line (Y=m*x + b; red line in the attached plot). The noise is coming from a Gamma distribution "centered" on zero (the mode, i.e., the maximum of the gamma distribution is lying over zero). When I plot this artificial signal (Y + g_noise; black dots in the plot) together with Y, I see Y nicely cutting the noise dots in the region of maximum density. I though this simple model of a straight line and asymmetrical not-normal noise is an "easy" task for a GLM and should exemplify its superior performance in comparison to least squares. So, I take Y as input of 2 linear models:
The classical least squares (Y_ls; green line in the plot). As expected, Y_ls is unable of reproducing the original signal Y but it performs quite good: It makes a straight line parallel to Y, cutting the noise dots not in the region of maximum density but in the "middle". Namely, Y_ls has offset in comparison to Y. This is in agreement with the Gauss-Markov theorem, since the noise is not normal, least squares cannot yield an unbiased linear estimator. I was expected this, so far so good.
A GLM with a Gamma canonical link. To my big surprise, Y_glm (magenta curve) is not only unable of reproducing the original signal, but from my point of view it even performs worse than Y_ls: It only fits the original signal in the middle of the distribution, which is OK, but at the beginning and end of the record Y_glm is a considerable poorer estimation in comparison to Y_ls, to the naked eye. A GLM with an identity link but Gamma variance ($\mu^2$) should, from my point of view, also performs well, but it simply reproduces Y_ls, meaning no improvement over least squares.
So, my questions are:
Am I misunderstanding the sense of a GLM? Am I doing something wrong? Is this really the best we can get of a GLM in comparison to least squares?
Is there another model (perhaps a GAM?) which would really be able of seeing through the data, identifying the Gamma noise and correctly reproducing the original line Y (the red line)?