How can I select the optimal number of categories that better represent a continuous predictor in the single-variable linear regression model?
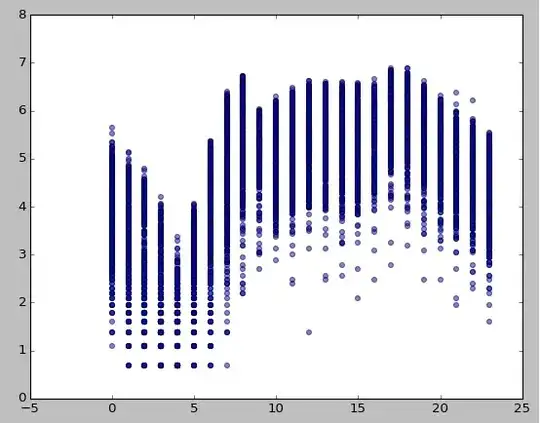
I constructed this scatter plot:
plt.scatter(train['pred'], train['resp'])
plt.show()
But it does not give me a clear idea. Is there any "automated" way?
