I am trying to do OLS regression to identify value-added predictors of an outcome. I've chosen predictors that are all zero-order correlates of my outcome. Then I began checking assumptions for each of those predictors. A few of my predictors are skewed above a guideline of >.8, and so I have attempted to transform those with power transformations, going down the ladder for positive skew (e.g. sqrt, and then natural log). These transformations successfully reduce the skew. However, after I make a trasnformation, I check graphical representations of residuals with the transformed variable and Y, such as the normal QQ plots and the plot of fitted residuals with a lowess curve. These graphics are either unchanged, or worse. As in, the tails of the normal QQ line are still curved, and the lowess curve is much less flat.
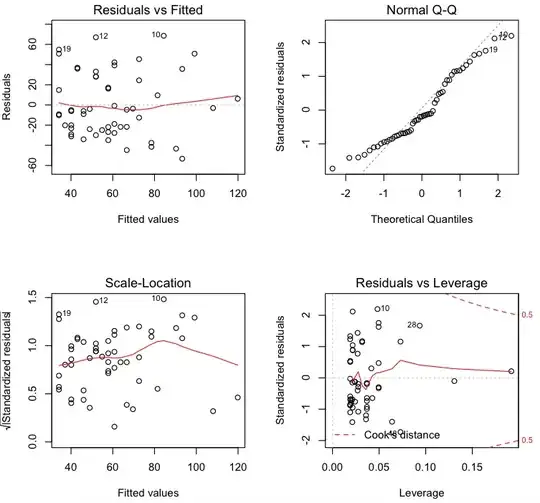
For example, here are the plots of the nontransformed variable. Lowess curve looks good, but QQ line is curvy at tails.

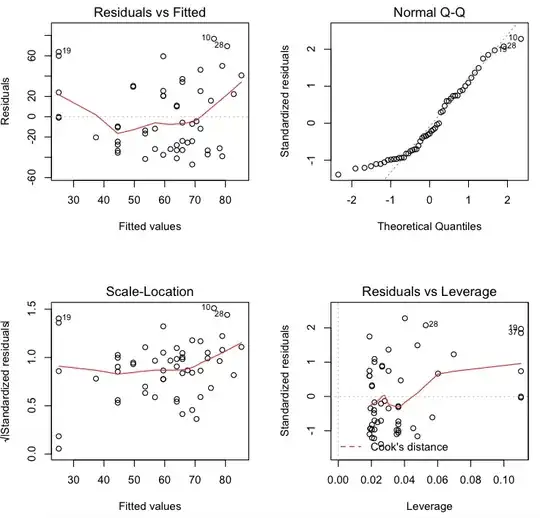
And here are plots of log transformed variable. Lowess curve is no longer flat and QQ line is still curvy! 
Am I supposed to continue moving down the ladder and visually checking these assumptions as I go? Are increasingly powerful transformations likely to improve my problem? Should I instead ignore the guideline of skew above .8 (Tabachnik and Fidell)?