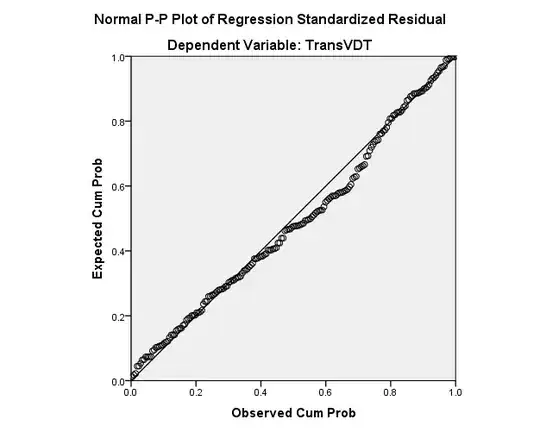
I am testing the OLS assumptions and I got the following normal P-P plot. Does it look normally distributed or not?
Asked
Active
Viewed 1,787 times
3
-
How many data points is that, 140? 150? How many predictors? – Glen_b Sep 13 '15 at 00:10
2 Answers
5
This looks fine to me, as far as that goes. What you are most concerned about is the tails of your distribution, and pp-plots don't show those very well. QQ-plots do better; see: PP-plots vs. QQ-plots.
gung - Reinstate Monica
- 132,789
- 81
- 357
- 650
0
There are formal tests for normality- in particular the Jarque-Bera/Skewness-Kurtosis type tests.
ChinG
- 741
- 8
- 24
-
1Jarque-Bera as I have seen it implemented uses asymptotic results for every sample size, a very bad idea as the convergence of sample skewness and kurtosis to normality is very slow indeed. – Nick Cox Nov 03 '15 at 19:21
-
-
2Not to me. Almost none of these tests can possibly compare with a Q-Q plot, which shows you how much and where data depart from normality. A K-S test is arguably most sensitive in the middle of the distribution, precisely where departures are least important. Cf. @gung's comments. – Nick Cox Nov 03 '15 at 19:32
