2

When calculating the prediction intervals for a regression function, can the y values be precise values "without errors"?

As far as I know, in regression function calculation only the x values are assumed to have no error and not the y values (see requirements below). But in computational chemistry the calculated values are precise per definition, as same input gives same output, so they don't have standard deviation or sth like that.

The mathematical requirements are, according to my literature (german DIN):

  • independent and normally distributed values
  • homogeneity between lowest and highest value's variance
  • a linear functional relationship where the x values count as errorless and the y values are assumed to have errors

They state: If those requirements are not satisfied, then the calculation scheme cannot be used and another scheme has to be chosen. And that last requirement is, what the question is about: What if both, x and y values, have "no error" ... is the system still usable or do I need something more appropriate?

For clarification, this is the system that should be treated:

$\hskip3.5cm$enter image description here

  • 1
    If the relationship between $x$ and $y$ is linear, i.e. $y=\alpha x + \beta$, and there are 'no errors' then you just have to take out two different points $(x_1, y_1)$ and $(x_2, y_2)$ and solve the system of equations $y_1=\alpha x_1 + \beta$ and $y_2=\alpha x_2 + \beta$ for $\alpha$ and $\beta$. –  Aug 25 '15 at 10:56
  • I don't mean that my y values are the same as the x values but only that as often as I "measure"=calculate the y values, they will be always the same. Normally there would be some experimental uncertainty that has to be assumed and that, I think, is one of the mathematical assumptions. – pH13 - Yet another Philipp Aug 25 '15 at 10:59
  • 1
    If there's no error, then why would you need regression at all? You can simply compute E(Y|x) by observing a single Y for any x you want. (Even better, if the model is correct, you only need to observe as many Y-values as you have unspecified parameters in the model to compute the population values exactly.) – Glen_b Aug 25 '15 at 11:51
  • 1
    A toy example & a clear statement of your goals might help to clarify what you're trying to do here. As @fcoppens points out, if you know the functional form of the relationship between $x$ & $y$ (which needn't necessarily be linear), estimation of the parameters is straightforward & prediction intervals are of zero width. It sounds rather as if *interpolation* between the calculated values might be what you're after - statistical models for this sort of problem have narrow prediction intervals for $y$ when $x$ is close to some calculated value & wide ones when $x$ is far away from any. – Scortchi - Reinstate Monica Aug 25 '15 at 11:56
  • 1
    I edited some more information into the question ... hope that helps in understanding it. – pH13 - Yet another Philipp Aug 25 '15 at 12:22
  • We've been reading your q. as about regressing $y$ on $x$ when the output $y$ is a deterministic, errorless function of the input $x$. That doesn't seem to square with the graph though - you're not saying that you calculate the "calculated value", say 1.19, *from* the "experimental value", say 2.12, are you? – Scortchi - Reinstate Monica Aug 25 '15 at 12:53
  • Exactly, I do not calculate the y values *from* the experimental values. Those are dipole moments that were either measured ($x$) or calculated by quantum chemistry ($y$). Each point is one molecule with a certain dipole moment. – pH13 - Yet another Philipp Aug 25 '15 at 13:05
  • 1
    So presumably, given a measured value $x$, there *would* be some variability in the calculated values $y$, which might be modelled as random "error"? That's a least a rather empirical way of approaching it. Another is, supposing you have a particular mechanism for the data-generating process in mind, to consider the errors as being in $x$: see [Is regression of x on y clearly better than y on x in this case?](http://stats.stackexchange.com/questions/69646/is-regression-of-x-on-y-clearly-better-than-y-on-x-in-this-case/69667) (I'm imagining there are some physical parameters that on ... – Scortchi - Reinstate Monica Aug 25 '15 at 14:44
  • 1
    the one hand are fed into a computer model to generate $y$ & on the other used to define the set up of an experiment to measure $x$.) – Scortchi - Reinstate Monica Aug 25 '15 at 15:04
  • I guess the *x on y* version should work. Then I can get a guess with an error range for the real measured property from my calculated property value. Thank you for help! – pH13 - Yet another Philipp Aug 25 '15 at 16:04

1 Answers1

2

First of all, deterministic (i.e. the same computation always yields the same result) does not imply error-free (not even free of random error!).


That being said, both ways of modeling, $y = f (x)$ as well as $x = f (y)$ are used in chemometrics. The former is known as ordinary or classical regression or calibration, the latter is referred to as inverse calibration.

Both ways of calibration have different characteristics.

  • As the comments already pointed out, one important difference is in the assumption where most of the variance is: on $x$ or on $y$.
  • In addition, if the purpose of the model is prediction, you should predict forwards, i.e. in the direction that is modeled. That is, if you want to predict experimental results, model $experiment = f (theory)$.
  • On the other hand, if you assume the error is on your theoretical model and you are interested in the relationship between theoretical model and experimental results (remember: experimental science makes the fundamental point that if experiment and theory do not agree, it is theory that needs to change) and you e.g. need to measure the slope between experiment and theory, then model $theory = f (experiment)$
  • (In chemical analysis as in measuring concentrations, there are more important characteristics, wrt. to how multivariate measurements are used, and whether all constituents of the system are known - but these are probably not relevant for your problem).

I work with vibrational spectra which are sometimes computed for molecules in vacuum and then a correction factor is applied to account for the difference between vacuum (theory) and solution (reality/experiment). While I may be biased because I'm experimental spectroscopist, I'd say that at least in this situation it is very clear where the major source of error is...


About the DIN: are you referring to DIN 32465 or 38402?

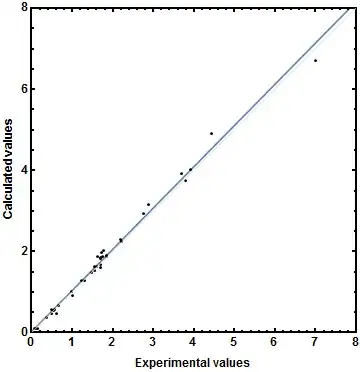
They give formulas that are valid only under the stated assumptions (which are also in chemical analysis very often not met, particularly the variance homogeneity (also your graph looks like increasing variance with increasing values). The consequence is that you cannot use the "shortcut" formulas but have to do the proper calculation. In particular, you'd underestimate the uncertainty for high values and overestimate uncertainty for low values. From a statistics point of view, a weighted regression would be appropriate.

However, partiularly if you need to measure figures of merit such as limit of detection LOD or limit of quantitation LOQ, there are straightforward (though tedious) methods to do this almost without assumptions.

cbeleites unhappy with SX
  • 34,156
  • 3
  • 67
  • 133