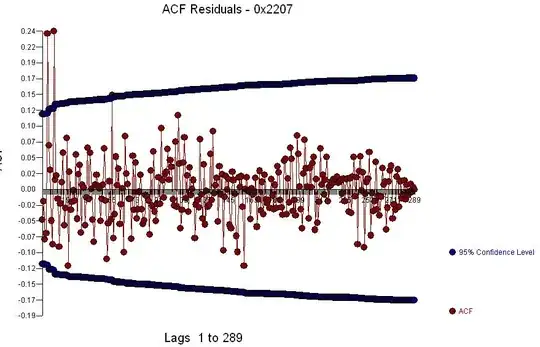
I am concerned about the residual plot shown. The (count) data are over-dispersed, with about 40% 0s, median is 2, maximum is 300 or so.
I am not sure what how to proceed with this - it is not exactly like any of the classic examples that are on various teaching websites, and I have not yet found a transformation that makes the plot look "well-behaved".
